Download
1 / 56
560 likes | 686 Views
P hoto A coustic I nstrument: An Ear for Black Carbon. By P at A rnott Collaborators: Hans Moosmüller, Fred Rogers, John Walker, Rick Purcell, Dan Wermers, Rich Raspet, Willie Slaton, James Mehl, Adel Sarofim, Kerry Kelly, Dave Wagner (Univ. Utah.)

E N D
PhotoAcoustic Instrument: An Ear for Black Carbon By Pat Arnott Collaborators: Hans Moosmüller, Fred Rogers, John Walker, Rick Purcell, Dan Wermers, Rich Raspet, Willie Slaton, James Mehl, Adel Sarofim, Kerry Kelly, Dave Wagner (Univ. Utah.) Funding over the Years: EPA, NPS, ONR, NSF, DOE, DOD-SERDP, DRI http://photoacoustic.dri.edu My other great passion -- Cirrus Clouds
Soot: 10 - 50 nm monomers chained together to form larger aggregates. ‘Onion Shell’ structure of the monomers. IMAGE CREDIT: http://7starm.asu.edu/Buseck2000%20/figure_10.htm TEM images of soot. A, B. Chain-like soot aggregates. (A--Phoenix, after Katrinak et al., 1993; B--Sagres, Portugal, ACE-2). C. High-resolution TEM image of the arrowed soot aggregate showing the onion-like structure of soot spheres. (Southern Ocean, ACE-1; after Pósfai et al, 1999).
Atmospheric Aerosol Applications and Research • Radiation transfer, light scattering and absorption, emission. • Climate simulation • Visibility at the National Parks • Military applications - sensor performance and plume visibility • Cloud albedo (Twomey effect, more aerosol, more competition for water vapor, smaller droplets, ammonium sulfate aerosol) • Cloud lifetime (Black carbon causes local heating from sunlight absorption, cloud dissipation). • Health effects • PM 2.5 levels are legislated • Likely that PM will be further differentiated into E.C., O.C., etc. • Source Level Combustion • Engine performance • Power plants
OUTLINE • Atmospheric and combustion aerosol. • Aerosol optics and instrumentation. • Calibration of the photoacoustic instrument for light absorption: • Nitrogen Dioxide gas • Kerosene-flame soot • Photoacoustic IOP at the DOE-SGP, March 2000. • Light absorption as a function of RH • Instrument evaluation • Conclusions and Questions
ATMOSPHERIC AEROSOL • http://www.cmdl.noaa.gov/aerosol/
Visibility: Good for tourism, bad for military when engine plumes become visible. • IMPROVE: (Interagency Monitoring of PROtected Visual Environments) • Aerosols are a dominant influence on man-made visibility impairment. • Aerosol optical properties are very important and are measured. National Park Service, Forest Service, Fish and Wildlife Service, Bureau of Land Management, and Environmental Protection Agency
Subset of aerosols: Those that strongly absorb visible light. • Typically formed from combustion of fuels in engines and from burning things. • Appreciable elemental carbon component. Approximate emission factors for different sources of elemental (black) carbon (from Ogren and Charlson, 1984).
Aerosol Optical Properties: Absorbing particles. For small optical depths, and D < 0.1 µm: I(L)/I(0) = e(-L L), L(1/m) ≈ S.O.C (m2/g) x r (g/m3), L = path length, r = aerosol concentration by mass. • Absorption dominates for D < 0.1 µm (Rayleigh scattering). • Aside: For non-absorbing aerosols, Extinction=Scattering. Note the strong dependence of the scattering coefficient on diameter!
More Realistic Optical Model for Absorption by Soot See: Lee, K O., R. Cole, R. Sekar, M. Choi, J. Zhu, J. Kang, and C. Bae, 2001. Detailed characterization of morphology and dimensions of diesel particulates via thermophoretic sampling. SAE Paper 2001-01-3572.
Rough Estimate of Aerosol Radiative Forcing: Clear Sky - Aerosol Loaded Sky, top of atmos. Aerosol Single scattering albedo = Scattering / (Scattering + Absorption)
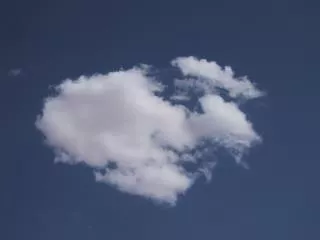
Humidity Influence on Light Scattering • http://www.cmdl.noaa.gov/aerosol/
Nephelometers Measure Light Scattering • These instruments operate by illuminating a fixed sample volume from the side, and observing the amount of light that is scattered by particles and gas molecules in the direction of a photomultiplier tubes. The instruments integrate over scattering angles of 7-170°
Simplified description of filter methods for light absorption. PSAP and AETHALOMETER • Aerosol are deposited on the light-diffusing filter, multiple scattering substrate. • Light absorbing aerosol reduce the light power at the photodetector. • Light scattering aerosol don't reduce power in principle. • Calibration and effects of aerosol loading (blocking)?? • We have noted Giant RH induced artifacts (PSAP).
PSAP: Particle Soot Absorption PhotometerA filter-based measure of light absorption. • Reference filter on the right. Aerosol-loaded filter on the left. Compare light transmission through these filters as a measure of light absorption.
Airborne Data Example from the PSAP Field data showing the high variability of aerosol light-absorption (Mm-1) with altitude, measured by NOAA/CMDL scientists aboard the C-130 research aircraft during the INDOEX field campaign. Profile was measured over the Indian Ocean at approximately 6 degrees north latitude on February 16, 2000. (Courtesy of P. Sheridan and J. Ogren, NOAA/CMDL.) http://www.ogp.noaa.gov/aboutogp/spotlight/aerosols/aero9_00.htm Data likely potential light absorption, relevant to a parcel at sea level and 273 K.
Aethalometer Data: Jumps on Filter Position Change: Data from Mark Green, DAS.
Aethalometer Data: Continued. Data from Mark Green, DAS, DRI. Aethalometer B.C. increase when new filter spot is used: Hypothesis: The multiple scattering filter substrate evolves in time as aerosol are deposited on it. The ‘amount’ of multiple scattering decreases as aerosol are added, causing the instrument calibration to actually vary with time. Solution: Don’t use filters!
Photoacoustic Instruments For Light Absorption Measurements • Basic principles: • Laser light is power modulated by the chopper. • Light absorbing aerosols convert light to heat - a sound wave is produced. • Microphone signal is a measure of the light absorption. • Light scattering aerosols don't generate heat.
FASCODE Babs for a horizontal path at 1 atm pressure, 1976 US Standard Atmos. gas composition. (Aid choice of laser wavelength).
National Instrument’s Labview is used for data acquisition and signal processing.
Photoacoustic Instrument Details: Equation to Obtain Light Absorption Coefficient.
High resolution spectrum of NO2 and the photoacoustic measurement • Uncertainty in laser wavelength and spectrum, and gas concentration.
Simultaneously measure extinction and absorption • This calibration method reduces the uncertainty in laser wavelength and spectrum.
Extinction ≈ Absorption for large dose of NO2 • Photacoustic measurement is the dashed line. Extinction and its uncertainty range are the solid lines.
Response with a particle filter before inlets • Kerosene flame produces NO2. The 532 nm instrument responds to NO2, but the 1047 nm instrument does not. Concentration ≈ 3 ppb NO2 per 1/Mm.
Kerosene flame soot optical properties • Key Points: • Babs(532 nm) ≈ 2 Babs(1047 nm), as expected for soot, Babs(l) µ 1/ l. • Single scatter albedo is less at 1047 nm than at 532 nm. Scattering is less at 1047 nm, proportionally less so than absorption. • The single scatter albedo at 532 nm is similar to published values for similar fuel burns. • Paper on calibration has been published (Rev. Sci. Instrum.)
Photoacoustic Data at 532 and 1047 nm Message: Babs correlates well with elemental carbon mass. Theoretical dependence of Babs on wavelength predicts about a factor of 2 difference in the absorption efficiency.
Photoacoustic Lower Limit: PARTICLE FREE AIR: 2 minutes average time, 200 mW 1047 nm laser. Background usually below 30 ng/m3.
PHOTOACOUSTIC INSTRUMENT DYNAMIC RANGE: Ratio of lowest to highest detected signals. 30 ng/m3 for 2 minutes averaging time. 30 mg/m3, demonstrated as fast as 2 Hz rep. Rate.
Mobile sampling from an RV. (Dave Campbell left, and Eric Fujita right.) Some Images of the Photoacoustic Instrument in Operation Sampling a vehicle (dyno) during a ‘unified’ driving cycle. PA and dusttrak installed in the Univ. West Virginia trailer for sampling from their dilution tunnel.
Continuous Measurements of Black Carbon … • Are very helpful in validating your sampling system. • Provide immediate feedback to average and instantaneous response of sources. • Draft data can be delivered minutes after a sampling period ends. • Not labor intensive. • Can be sliced and diced 100,000 different ways to find out the conditions that give rise to maximal or minimal emissions, etc.
Photoacoustic IOP, MARCH 2000, DOE-ARM SGP Site GOALS: Compare performance and calibration of filter-based instruments routinely used at the SGP with the photoacoustic method. Evaluate the dependence of light absorption on relative humidity. Hoped for, and had the following conditions… Clean air for background level comparisons (after rain). Air mass from long range transport of aerosol (moderately dirty air). Dirty air mass from local farmers burning their fields.
Block Diagram of the SGP measurements New instruments: PSAP #2 and Photoacoustic instrument, downstream of the humidified nephelometer.
Quick-look light absorption at the SGP • Photoacoustic measurements are in red, PSAP in black. The PSAP filter was overloaded during the smoke events.
Linear correlations of PSAP#1 and PA • Very strong correlation. Slope indicates PSAP values are larger. Preliminary results, more evaluation in progress this summer at DRI.
f(RH) = PhotoacousticBabs(RH) / DryPSAPBabs • Interpretation: Photoacoustic instrument shows lower Babs as RH increases. • Aerosol optics may change upon humidification (collapse chain aggregates) • Sample line or humidifier particle losses may increase with RH • Photoacoustic measurement may be influenced by RH via mass transfer.
PSAP # 2, humidified instrument, Quick Look • Babs (1/Mm) vs Julian Day. Ramps coincide with humidification ramps. Suggests caution when interpreting PSAP measurements done at high RH. • Cellulose backing of filters is very hygroscopic. Fibers swell when they take up moisture, causing apparent light absorption.
7 Wavelength Photoacoustic Instrument Sketch. 355 nm to 1047 nm. Gas calibration by oxygen at 760 nm on each measurement cycle.