Download

1 / 37
370 likes | 567 Views
An Introduction to Helioseismology (Local). 2008 Solar Physics Summer School June 16-20, Sacramento Peak Observatory, Sunspot, NM. Local Helioseismology. What is Local helioseismology? Comparison with Global Helioseismology History Why Local Helioseismology

E N D
An Introduction to Helioseismology(Local) 2008 Solar Physics Summer School June 16-20, Sacramento Peak Observatory, Sunspot, NM
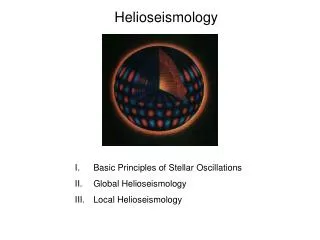
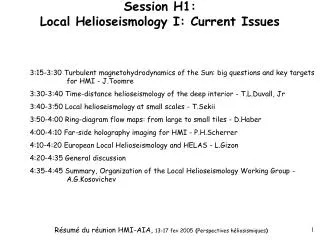
Local Helioseismology What is Local helioseismology? Comparison with Global Helioseismology History Why Local Helioseismology Observations for Local Helioseismology The three main methods Ring diagram analysis Time Distance Seismic Holography (seismic imaging) The Space Weather connection
Global Modes • A p mode is a standing acoustic wave. • Each mode can be described by a spherical harmonic. • Quantum numbers n (radial order), l (degree), and m (azimuthal order) identify the mode. • -l m l
Global vs Local Local • No horizontal interference, can have any wavelength • Localized volume is sampled • Sinusoids or Hankel functions describe waves • Longitudinal structure can be determined • Non-symmetric latitudinal structure can be determined • Several techniques • Valid for ℓ > ~180 Global • Horizontal interference selects integer values of ℓ • Entire sun is sampled • Spherical harmonics describe waves • Cannot get structure as function of longitude • Cannot get non-symmetric latitudinal structure • One basic technique • Valid for ℓ < ~180
History • 1987: Sunspots are observed to absorb p-modes • 1988: Ring diagram method is invented • 1990: Acoustic holography is invented • 1993: Time-distance method is invented
Why local helioseismology ? • Infer dynamics and structural parameters of localized areas of the Sun • Difference between North and South hemisphere • Longitudinal discrimination • Meridional circulation • Structure and dynamics of active regions and filaments
Observations • High spatial resolution velocity or intensity images • Current Instruments: • GONG • MDI on board of SoHO • SOT on board of Hinode • Future: • HMI on board of SDO • PHI on board of Solar Orbiter
Networks • Six stations around the world for continual coverage. • 256x256 pixels 1995-2001 • 1024 pixels since 2001 • Run from NSO Tucson.
Space Instruments 1996 - Present Coming Soon…. MDI GOLF VIRGO HMI
1664 min 16o Ring Diagram Analysis
l- diagram Ring-Diagrams analysis Rings of Power
Ring-Diagrams analysis No tracking, solar rotation rate of 2000 m/s With tracking to remove rotation
Ring-Diagrams analysisSolar Rotation Confirmation of the solar rotation shear layer from local helioseismology
Ring-Diagrams analysisMeridional Flow: removing surface activity
Ring-Diagrams analysisDynamics of Active regions AR 10069 AR 10486
Time distance • Sound travels from a particular location, down, and comes back up at some time later and some distance away from the source. • The time and distance is influenced by the conditions of the plasma that the wave travels through. • More resolution that ring-diagrams. • Reach deeper layers
Time distance Observed time-distance diagram Cross-correlation function is well described by a Gabor wave packet
Time distanceMeridional Flow 30 Mm 65 Mm 130 Mm 200 Mm
EARTH Egression/Ingression Pupil Seismic holography (seismic imaging)
Seismic holography (seismic imaging) Phase of the Correlation • Phase-difference due to: • Reduction of gas pressure in magnetic region --> displacement of density variation • Sound speed enhancement (evidence from acoustic moats) due to thermal anomalies • Inclination of the magnetic field
Sept 7 2005 AR10808 Source: MLSO K-coronameter Seismic holographyPrediction capability Active Region NOAA-10808 Aug 29 Sep 9 2005 (GONG) sin(latitude) Carrington Longitude
AR10808 Active Region NOAA-10923 Oct 31 -> Nov 10 2006 AR10923 sin(latitude) Calibrating the far-side maps Active Region NOAA-10808 Aug 29 -> Sep 9 2005 sin(latitude) Carrington Longitude
Comparison of methods • Rings: easy and intuitive; low spatial resolution and shallow depth range • TD: harder; higher spatial resolution and greater depth range, but inversions…. • Holography: Similar to TD, but needs a good understanding of the Green’s functions. • All methods have a trade-off between depth range and spatial resolution
Local helioseismology & Space Weather • Images of activity in the far side of the Sun • Flare prediction • Emerging active regions
To Do • Huge list!!!! For more information • http://www.hao.ucar.edu/summerschool/program.html • Has links to very detailed lecture notes on helioseismology and solar internal dynamics