Download
1 / 11
110 likes | 259 Views
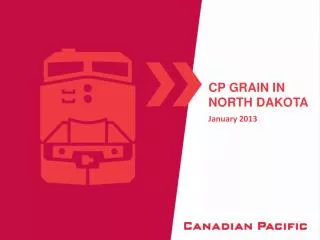
CP Grain in North Dakota. January 2013. Canadian pacific. Track miles: 14,700 Expense Employees: 14,200 Annual Carloads: 2.6 Million 2011 Revenues: $5.2 Billion Global reach through ports of Vancouver and the US PNW, Thunder Bay / Duluth, Montreal, & NEUS

E N D
CP Grain in North Dakota January 2013
Canadian pacific • Track miles: 14,700 • Expense Employees: 14,200 • Annual Carloads: 2.6 Million • 2011 Revenues: $5.2 Billion • Global reach through ports of Vancouver and the US PNW, Thunder Bay / Duluth, Montreal, & NEUS • North American reach through major hubs at Chicago, Minneapolis & Kansas City
Book of business Grain – CP’s Single Largest Commodity Bulk 44% Grain 22% Coal 11% Sulphur & Fertilizer 11% Merchandise 30% Industrial & Consumer 19% Automotive 7% Forest Products 4% Intermodal 26% Import/Export 13% Domestic 13%
Achieving record empty order fulfillment for US grain this crop year Reducing grain car cycles by nearly 20% Have secured target of $400 million of energy growth Crude, frac sand, other inputs Will reach 70,000 car per year run rate in crude oil shipments in Q1 2013 Grain & crude The odd couple For CP, Energy development in North Dakota has been going on since 2009. The expansion of our energy portfolio has supported technology, capacity and operational improvements that have benefitted our grain business, resulting in our ability to move a record number of grain cars this crop year.
NORTH AMERICAN PRODUCTION AB Production: 18,077,000* SK Production: 26,155,000* MB Production: 7,538,000* MN Production: 38,512,328** ND Production: 9,354,656** CP Rail Network SD Production: 19,656,232** * 6 majors + specialty crops, 5 Year Average (07/08 to 11/12) – metric tonnes ** Corn and Soybeans, 5 Year Average (07/08 to 11/12) – metric tonnes Source: http://www5.statcan.gc.ca/cansim/a26
Energy - CP Positioning • Well established network for multiple traditional energy plays • Making / expanding markets in AIH, Marcellus and in Ethanol 4 Marcellus shale Ethanol Bakken oil formation Alberta’s Industrial Heartland CP Serves North America’s Most Compelling Energy Opportunities 5
Edmonton Sutherland Calgary Winnipeg Moose Jaw Vancouver Thunder Bay Lethbridge Kingsgate Coutts Sudbury Montreal Glenwood St Paul Toronto Huron Detroit Binghamton Buffalo Mason City Chicago Nahant Sunbury Kansas City Canadian Pacific Infrastructure ProgramNorth Dakota and Minnesota 1 8 2 1 3 7 4 2 3 4 6 5 Projects completed in 2011 Portal Sub - Flaxton - siding extension (8500ft) & two yard track extensions Portal Sub - Harvey - West - extend inspection track Newtown Sub - Max yard phase l – track extension Newtown Sub - Newtown - runaround track Projects completed in 2012 Carrington Sub – Harvey – yard expansion headroom east Elbow Lake Sub – Enderlin – extend yard tracks Newtown Sub – Drake – Newtown sub siding/yard reconfigure Newtown Sub – Max yard phase ll – track extension Newtown Sub – Various – AEIs/Radio Towers/HBDs Detroit Lakes – Henning – siding extension Detroit Lakes – Marsh Creek – new siding Noyes – Lake Bronson - siding extension
Sustainable Service Improvements Recent changes to CP’s operating plan along with changes to our Products & Services and order systems have greatly improved EOF and cycle times for Grain. -24% YOY -18% vs a 3-yr avg -27% YOY -17% vs a 3-yr avg +34% YOY +20% vs a 3-yr avg CP is creating sustainable capacity to move more grain.
Corporate Operating Metrics ~30% ~30% ~20% ~25% Driving significant improvement
positioned for success Grain and Crude • Grain • Responded to industry changes developing new markets and leveraging our entire North American network • Successfully implemented our grain improvement initiative including the Grain Car Request System (GCRS) • Positioned to drive further capacity, service delivery and asset utilization improvements • Crude • Expanding in step-wise and collaborative way • Achieving mutual commitment and investment • Providing service and optionality value