Introduction to CASA and Basic Data Reduction Overview
Introduction to CASA and Basic Data Reduction Overview. Steven T. Myers CASA Project Scientist (NRAO). Beta Release Status. CASA Status: in Beta Release since October 2007 roughly quarterly “patches” Current Release: Beta Release Patch 3 target release date October 15 general release

Introduction to CASA and Basic Data Reduction Overview
E N D
Presentation Transcript
Introduction to CASA and Basic Data Reduction Overview • Steven T. Myers • CASA Project Scientist • (NRAO)
Beta Release Status • CASA Status: • in Beta Release since October 2007 • roughly quarterly “patches” • Current Release: Beta Release Patch 3 • target release date October 15 • general release • register at my.nrao.edu , no password for download
Beta Disclaimer • This really is a Beta Release! • still missing functionality • there are known failure modes • will find new problems • Improvements in upcoming patches • move towards handling ALMA/EVLA “use cases” • better handling of calibration
Curriculum • schedule: • ~1 hour orientation lecture + demo (this talk) • hands-on data reduction with datasets: • VLA Continuum Polarization (3C129) • VLA Spectral Line (NGC2403) • BIMA 3mm line mosaic (NGC4826) • intended to be interactive • if you need help - ask!
Starting CASA • From your workstation (running RHEL): • type ‘casapy-test’ at prompt • this is the pre-release test version of Beta Patch 3 at AOC • quit CASA using ‘exit’ • brings up IPython shell plus casalogger GUI • Other releases available for download • not yet built for Patch 3...
Getting User Support • First stop: Read the Manual! • CASA Home: http://casa.nrao.edu • Cookbook, and “help” within CASA • CASA Helpdesk & Support Cadres • “Helpdesk” under my.nrao.edu • submit Issues • User Support Specialists (Gustaaf at AOC) • will handle your Helpdesk ticket and interface with developers
Tutorial Contents • I - Interface • II - Tasks & Tools • III - Data in CASA • IV - Data Processing Workflow • V - Example Use Cases
I - Interface • Documentation • IPython & Python • Crashes & Recovery • CASA help • CASA task interface • Functionality
CASA Documentation • CASA Analysis cookbook (draft): • http://casa.nrao.edu/Doc/Draft/Cookbook/casa_cookbook.pdf • CASA User Reference Manual: • http://casa.nrao.edu/docs/casaref/CasaRef.html • Python: • http://python.org/doc (e.g., see Tutorial for novices) • IPython: • http://ipython.scipy.org/moin/Documentation • matplotlib: • http://matplotlib.sourceforge.net/
CASA Interface • IPython • shell access • autoparenthesis (autocall) • command history • session logging (ipython.log, casapy.log) • numbered input/output • history/searching • Python • see standard manuals, Cookbook Appendix D
Python Pointers • to run a .py script: • execfile(‘<scriptname>’) • example: execfile(‘ngc5921_demo.py’) • indentation matters! • be careful when doing cut-and-paste to Python • cut a few (4-6) lines at a time • variables are global! • tasknames are objects (not variables)
Crashes & Recovery • Beta Release still has crash modes • plotting in particular (plotxy and plotcal) can get a segmentation fault • If in doubt, exit and restart casapy • get rid of orphaned loggers • you may have to use ps to find rogue casapy processes and kill them
Part II - Tasks & Tools • overview of tasks and tools in CASA • introduction to the task interface • how to get help on tasks and tools • how tools underly the tasks • how to run tasks asynchronously
Tasks and tools in CASA • Tasks - high-level functionality • function call or parameter handling interface • these are what you should use in tutorial • Tools - complete functionality • tool.method calls, used by tasks • sometimes shown in tutorial scripts
Key Tasks • Task list: • may be different in test and release versions • asap_init to load single-dish tasks and tools
Task Execution • two ways to invoke: • call from Python as functions with arguments • taskname( arg1=val1, arg2=val2, ... ) • unspecified parameters will be defaulted (globals not used) • use standard tasking interface • use global variables for task parameters • see Chapter 1.3 in Cookbook
Task Interface • standard tasking interface • use parameters set as global Python variables • set <param> = <value> (e.g. vis = ‘ngc5921.demo.ms’ ) • parameter manipulation commands • using inp , default , saveinputs , tget • execute • <taskname> or go ( e.g. clean() ) • return values • some tasks return Python dictionaries, e.g. myval=imval()
Task Interface • examine task parameters with inp :
Expandable Parameters • boldface parameter are expandable
erroneous values in red Parameter Checking • sanity checks of parameters in inp :
Help on Tasks • In-line help <taskname> command:
Tools in CASA • CASA Toolkit underneath tasks • core AIPS++ code (mostly in C++) • tools are functions • call from casapy as <tool>.<method>() • default tool objects are pre-constructed • e.g. imager (im) , calibrater (cb), ms (ms) , etc. (see toolhelp)
CASA Tool List • list of default tools from toolhelp : • tools described in the CASA User Reference Manual: • http://casa.nrao.edu/docs/casaref/CasaRef.html
Asynchronous Tasks • run tasks in background • set parameter async=True • runs as separate process • use taskmanager tool (tm) to monitor (Cookbook Chapter 1.3.2) • messages will appear in logger in the asynchronous order • useful to avoid known problems (e.g. exportfits / importfits) • cannot retrieve return values from async tasks
III - Data in CASA • data in CASA are stored in tables • interferometry data in Measurement Sets (MS) • also tables for images and calibration tables • formats and structures defined in CASA memos • accessed through table and ms tools • row and column structure is logical not physical
The Measurement Set • the MS is a directory on disk • the MAIN table in table.* files • also contains sub-tables • e.g. FIELD, SOURCE, ANTENNA, etc. • sub-tables are sub-directories • to copy must cp -rf to get contents • WARNING: moving a MS can break cal-table dependencies
Example MS • Example: ls ngc5921.usecase.ms • ls ngc5921.usecase.ms/FIELD
MAIN Table Contents • Example using task browsetable:
More MS Details • often will refer to “rows” & “columns” • rows = integrations in spectral windows • columns = time, u, v, w, DATA, weights, etc. • there are “scratch columns” • created when needed - can bloat the MS • but (usually) less space than scratch copy of MS! • CORRECTED_DATA , MODEL_DATA, IMAGING_WEIGHTS
Data Selection • standard MS selection syntax • see Chapter 2.5 of CASA Cookbook • syntax detailed in CASA Memo • http://casa.nrao.edu/Memos/msselection/index.html
Selection Example • standard selection parameters • e.g. for task gaincal: • field and spw common standard selections • expandable selectdata with other selections as sub-parameters
Selection Syntax • see Chapter 2.5 of Cookbook • field - string with source name or field ID • can use ‘*’ as wildcard, first checks for name, then ID • example: field = ‘1331+305’ ; field = ‘3C*’ ; field = ‘0,1,4~5’ • spw - string with specwindow ID plus channels • use ‘:’ as separator of spw from optional channelization • use ‘^’ as separator of channels from step/width • example: spw = ‘0~2’ ; spw = ‘1:10~30’ ; spw = ‘2~5:5~54^5’
Selection Syntax • see Chapter 2.5 of Cookbook • antenna - string with antenna name or ID • first check for name, then ID (beware VLA name 1-27, ID 0-26) • example: antenna = ‘1~5,11’ ; antenna = ‘VA*’ • timerange - string with date/time range • specify ‘T0~T1’ , missing parts of T1 default to T0, can give ‘T0+dT’ • example: timerange = ‘2007/10/16/01:00:00~06:30:00’
IV - Reduction Philosophy • data is imported into MS • keep original DATA inviolate • calibration is carried in cal-tables • will discuss cal-table philosophy later • imaging creates images from MS • feed back model images for self-calibration
Data Philosophy • Original data kept intact by default • DATA (and WEIGHT) columns • do not change in original MS • user can use toolkit to mess with these also • MS “scratch columns” are used • used for adjusted data and model visibilities • BETA: user must keep track ; Post-Beta: hide table and MS state
CASA Workflow Chart • workflow: • import • examine / flag • calibrate • image • analyze
Workflow Steps • follow rough workflow path: • import data (from UVFITS or archive formats) • examine data and edit out bad visibilities • calibrate data (through cal-tables) • image data (various deconvolution methods) • image and uv analysis (e.g. moments) • data and image visualization (whenever needed)
Import Data • see Chapter 2 of Cookbook • task importuvfits • UVFITS data (e.g. from AIPS) • task importvla • VLA “export” format (e.g. from archive) • task importasdm • ALMA data format (also EVLA eventually)
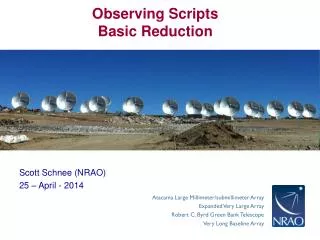
Data Examination • see Chapter 3 of Cookbook • task listobs • list summary of MS • task plotxy • x-y line plots • task browsetable (casabrowser outside casapy) • Qt browser for tables (e.g. MS and images) • casaviewer - view raster images of MS
Flagging • see Chapter 3 of Cookbook • task plotxy • draw boxes around points and flag • casaviewer ( task viewer ) • draw boxes on raster and flag (modes similar to AIPS TVFLG) • task flagdata - manual flagging, clipping, etc. • task flagmanager - backup & restore flags
Task plotxy • use plotxy for simple data plots & flagging before (left) and after (right) editing and calibration
Task plotxy • interactive plotting and flagging • averaging • timebin, width (time & channel averaging) • iteration • iteration = ‘antenna’ , ‘field’ , ‘time’ , ‘spw’ (or combinations) • GUI controls • buttons for MarkRegion , Flag , Unflag , Locate , Next , Quit • plot options • use subplot = yxn to set multi-panels (e.g. subplot=311) • controls for fontsize , markersize , other options
Example inputs • set up to plot amp vs. time
Editing Jupiter • isolate blocks of bad data and remove single bad scan on Jupiter both spw , all antennas
MS viewing • the casaviewer can handle MS (e.g. TVFLG)
Calibration • see Chapter 4 of Cookbook • prior calibration • solving • calibration table manipulation • calibration table examination • application to data
Calibration • workflow: • input dataset • solving => tables • incremental • accumulation • application
Calibration Tables • calibration tables are exchanged between the calibration tasks:
Calibration Tasks • prior calibration: setjy • solvers: gaincal, bandpass, polcal, blcal, fringecal • manipulation: plotcal, accum, smoothcal • application: applycal, split • other: uvcontsub, uvmodelfit
Parameterizations • prior calibration: • gaincurve: VLA-only for now • opacity: single tau value (for now) • gaincal: • gaintype=’G’ (solution per solint time slot) • gaintype=’GSPLINE’ • bandpass: • bandtype=’B’(solution per channel) • bandtype=’BPOLY’ • No time-dependence yet