Download
1 / 86
860 likes | 880 Views
This paper explores the measurement of quality, cost, and value of IT services, with a focus on the IT organization at Indiana University. It discusses the importance of quality, customer surveys, activity-based costing, and user satisfaction surveys.

E N D
Measuring Quality, Cost, and Value of IT Services Christopher S. Peebles, Craig A. Stewart, Brian D. Voss, and Sue B. Workman Office of the Vice President for Information Technology and University Information Technology Services Indiana University Paper presented at the 55th Annual Quality Congress, Charlotte, NC Tuesday, 8 May 2001
License Terms • Please cite as: Peebles, C.S., C.A. Stewart, B.D. Voss, and S.B. Workman. 2001. Measuring Quality, Cost, and Value of IT Services. Presentation. Presented at 55th Annual Quality Congress, Charlotte, NC, Tuesday, 8 May 2001. Available from: http://hdl.handle.net/2022/13897 • This content is released under the Creative Commons Attribution 3.0 Unported license (http://creativecommons.org/licenses/by/3.0/). This license includes the following terms: You are free to share – to copy, distribute and transmit the work and to remix – to adapt the work under the following conditions: attribution – you must attribute the work in the manner specified by the author or licensor (but not in any way that suggests that they endorse you or your use of the work). For any reuse or distribution, you must make clear to others the license terms of this work.
IU in a nutshell • Founded in 1820 • $2B Annual Budget • 8 campuses • >90,000 students • 3,900 faculty • 878 degree programs; >1,000 majors; > 60 programs ranked within top 20 of their type nationally • University highly regarded as research and teaching institution
IT@IU in a nutshell • Academic programs in IT through computer science, library and information sciences, engineering and technology, and most notably through new School of Informatics • CIO: Vice President Michael A. McRobbie • ~$70M annual budget • Technology services offered university-wide • UITS comprises ~500 FTE staff, organized into crosscutting units (e.g. finance and HR) and four technology divisions (Teaching & Learning Information Technology,Telecommunications, University Information Systems, Research and Academic Computing)
Transformations A Bit of Anthropology of Organizations and How IT Is Organized
Culture, Strategy, Organization & Structure Culture, Strategy, Organization & Structure • Mary Douglas. How Institutions Think. Syracuse University Press, 1986. Dimensions of Grid and Group )
Culture, Strategy, Organization & StructureContinued • James Cortada. Best Practices in Information Technology. Prentice Hall, NY, 1999 hackers
Value • IT and Value Creation • It’s all about time: powers of automation and augmentation • IT and Value Destruction • It’s all about time: wasted time due to poor operating systems, poorly crafted applications, and mysterious, opaque user interfaces • IT and Value Protection • It’s all about time: time spent in support and education
Measures of Performance and Success • Do not have measures like EVA and “profit” as a measure for the success of university IT organizations • Must draw exemplars from business and benchmarks from wherever they are available • Organization performance: IBM “Adaptive Organization” and “Customer Relationship Management” • Measurement: “The Balanced Scorecard” and “Counting What Counts”
Performance Measures for All Organizations, Including University IT Organizations • Robert Kaplan and David Norton. The Balanced Scorecard. HBS Press, Boston, MA, 1996. • Four dimensions of retrospective and prospective measures • Financial perspective: deployment (and growth) of revenue, ABC against internal (historical) and external benchmarks • Customer perspective: customer satisfaction measures, number of partnerships with faculty in teaching and research, support of university business processes, support of library processes • Internal perspective: process measures, classic IT measures of availability, cost-of-poor-quality, speed and depth of development cycles • Learning perspective: employee satisfaction, employee development (MSCE, CCNE, etc.), personal alignment of employee goals with position
Measuring Quality and Cost Customer Surveys Activity Based Costing
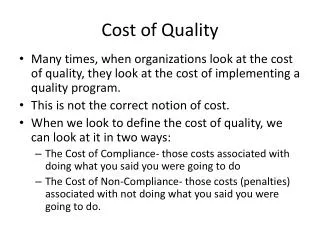
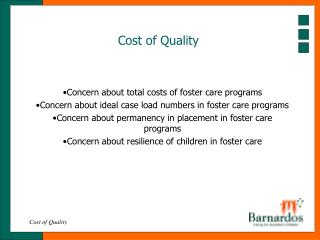
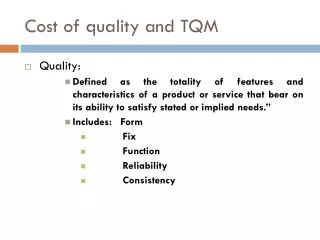
Importance of Quality • Claiming that quality is important is easy. Doing something useful is hard. • Measurement of quality requires • Leadership initiative • Understanding your services • Commitment to two-way, fact based communication with customers • Motivations at IU • Initiative • Feeling of responsibility • Responsibility center management
RCM • RCM Implemented at IU in 1989 (Whalen 1991). • IT organization(s) defined as a Responsibility Center; paid for through a non-discretionary tax on other RCs • IT customers are also captive users • Why not decentralize?
User Satisfaction Survey • Created out of leadership desire for quality and accountability, and desire for fact-based response to assaults on IT center’s budget • Key features of Survey • Administered by independent survey organization • Stratified random sampling; survey center finalizes and administers survey, performs randomization, tabulates responses, ensures anonymity • This assures credibility and quality of data • Longitudinal comparisons assured by consistency of questions from year to year
User Satisfaction Survey details • Undergraduate students, graduate students, staff, and faculty sampled. N has varied; current 1000 undergrad, 500 each remaining category per campus • Likert scale, Y/N questions, demographic information, opportunity for comments at end • Data reported as average score (+ 95%CI),satisfaction percentage (percent scoring 3-5), percentage who use a service. • All results, including every text comment ever written [identifying references deleted] available on the Web at http://www.indiana.edu/~uitssur
Overall quality maintained by attention to individual services Satisfaction with Stat/Math Center
Survey Credibility and Utility, 1 • Response rates: • IUB survey response rates in 1991 ranged from 23% (undergraduates) to 50% (faculty). • IUB response rates in 2000 ranged from 41% (undergraduates) to 71% (staff) • IUPUI survey initiated in 1997 with a 26% response rate for undergraduates • IUPUI response rate for 2000 at 36% (undergraduates) to 48% (staff) • High response rate due to small incentive ($5-$10 value) and to recognition of value of survey
Survey Credibility and Utility • External • Results disseminated rapidly and widely. Survey conducted Feb-end of April; results on Web in July or August • Results, and actions taken as a result, publicized widely throughout the year • Internal • Key component of annual internal quality assessment/plan • Often used in internal proposals as justification
Survey Credibility and Utility: VAX phaseout as an example • IU had largest academic VAX center in US, and had depended upon VAXes for ~15 years • IT organization announced plan to eliminate use of VAXes within 3 years in 1994 • Cost and quality measures informed this decision • Reaction: horror, humor, horror
VAX phaseout reaction • Horror: initial reaction of user community. Project leader set the following goal: Within two years, at least 95% of those surveyed would respond “yes” to the question “Is the improvement in your computing environment sufficient to more than outweigh the cost to you of conversion” • Humor: initial reaction of some colleagues • Horror: reaction of project team when they realized the project manager was serious
VAX phaseout: the results • The goal was met. • The setting of user satisfaction (rather than computer center convenience) as a key goal resulted in openness to the project that was essential to its success • Full details on Web: Stewart, C.A., et al. 1998. Changing (almost) everything and keeping (almost) everyone happy. CAUSE/Effect 21:39-46. http://www.educause.edu/ir/library/html/cem9837.html • Key lesson: if you are doing the right thing and communicating well, user opinion will not lag far behind expert opinion
Activity based Costing • “There are no results inside an organization. There are only costs.” • Peter F Drucker, Managing the Nonprofit Organization: Principles and Practices. Harper Collins, NY, 1990. p. 120 • Activity Based Costing-Activity Based Management • John Shank and Vijay Govindarajan. Strategic Cost Management. Free Press, NY, 1993 • Robert Kaplan and Robin Cooper. Cost and Effect. HBS Press, Boston, MA, 1998
The Ferengi “First Rule of Acquisition”: Once you have their money, never, ever give it back
UITS Services — Bloomington Campus1998-1999 Fiscal YearReport on Cost and Quality of Services
UITS Services — Bloomington Campus1998-1999 Fiscal YearReport on Cost and Quality of Services
UITS Services — Bloomington Campus1998-1999 Fiscal YearReport on Cost and Quality of Services
ABC data • Full reporting of data on Web at http://www.indiana.edu/~uits/business/scindex.html
A Case Study of Activity Based Management Reengineering E-Mail at Indiana University Bloomington
Volume and Cost for e-mail services at Indiana University Bloomington, 1996 - 1998 Academic Years.
User perceived quality measures for five mail systems used at Indiana University Bloomington, 1996-1998 Academic Years
Comparative measures for e-mail support requests in Indianapolis and Bloomington during the academic year 1998-1999.
Balanced Scorecard: example from Research & Academic Computing • Service measures (for all, current levels and from last year) • Quality – from user survey • Utilization – from user survey • Cost • Staff • Turnover • % receiving some sort of external certification • Results • Number and $s of grants applied for or supported • Number and $s received (not less than $1M in last 3 years) • Publications • Enabled by our services • By IT organization staff
Quality Planning • Internal quality plan written by each management unit, focusing on assessment and plans for improvement • User survey and ABC data key indicators • Any service with a satisfaction rating of less then 90% is generally taken to be cause for action • IT center budget office, which has customers only within the IT center, does its own annual survey!
IT Support@IU Support in Breadth
IT Support at Indiana University • IT has invaded our lives and culture • Demands for IT support increased exponentially • Budgets remained steady (at best) • How do we deliver a quality product under such a knowledge crisis?
Some background • Support free, unlimited to 115,000 IU Faculty, Staff, Students. • End-user, general-purpose support provided by central computing organization (UITS) • Support Center • Knowledge Base • Student Technology Center Consultants • Residential IT Support • Education Program
Support Center • Provide support to 400,000 contacts/year • Campus-based centers • Variety of questions/platforms • Various support delivery methods • Call Center • Walk-in Center • Online
Call Center • Calls distributed to ACD routed queues • Computers/Applications w/ Windows OS • Computers/Applications w/ Macintosh OS • Computers/Applications w/ Unix OS • Mission Critical Systems • General IT questions
Walk-In Center • Campus-centric locations • Support requiring personal authentication • Computer configuration • General-purposes support of convenience
Online Support • Support via e-mail • Knowledge Base
Managing the quantity of contact • Proactive versus reactive support • Tools to reduce time of contact • Increase quality of answers
Measuring the Quality of Contact • Annual Department Survey • Daily Support Center Survey • Simple measures • Non-intrusive to customer • Indicator of quality of service
The 3 Key Indicators 1. Did the customer receive a solution 2. in a timely manner 3. and delivered courtesy and respect ?
What do we do with the info? • Send to 45 users from day before • Every response is read and every “no” receives a response. • Used as indicator of need for training or resource allocation • Positive feedback Date: Mon, 15 Jan 2001 11:15:49 -0500 (EST) From: kdyn <kdyn@indiana.edu> To: <scpc@indiana.edu> Subject: Re: Dell Optiplex GX1..MS Natural Keyboard (#269.1445) THANKS, Jim. Please forward my message on to your boss – this is the BESTservice I've ever gotten on ANY computer- related problem anywhere. I'mglad my technology fee is paying your salary. THANKS.
Results for first 10 months of 2000 Total Responses% Satisfied Users Call Center1067 92.7% Walk-In Center14894.6% via Email19588.2%