Download
1 / 18
180 likes | 293 Views
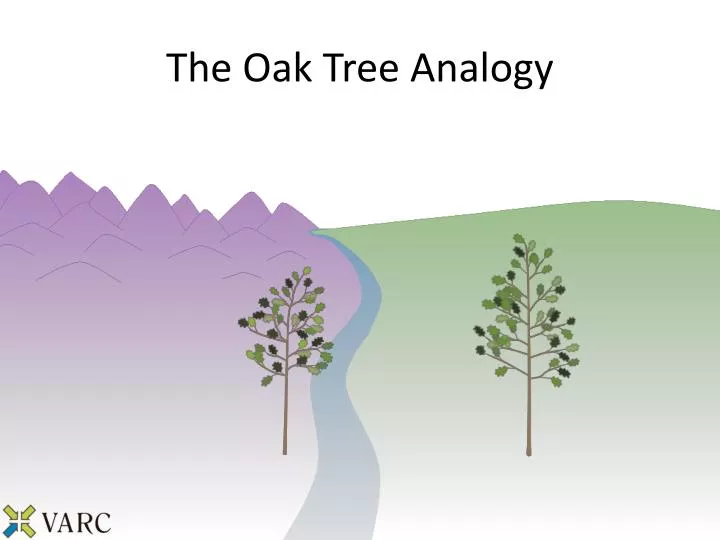
The Oak Tree Analogy. Explaining the concept of value added by evaluating the performance of two gardeners. For the past year, these gardeners have been tending to their oak trees trying to maximize the height of the trees. .

E N D
Explaining the concept of value added by evaluating the performance of two gardeners • For the past year, these gardeners have been tending to their oak trees trying to maximize the height of the trees. • Each gardener used a variety of strategies to help their own tree grow… which of these two gardeners was more successful with their strategies? Gardener B Gardener A Gardener B Gardener A
To measure the performance of the gardeners, we will measure the height of the trees today (1 year after they began tending to the trees). • Using this method, Gardener B is the better gardener. This method is analogous to using an Achievement Model. 72 in. Gardener B Gardener A 61 in.
… but this achievement result does not tell the whole story. • These trees are 4 years old. • We need to find the starting height for each tree in order to more fairly evaluate each gardener’s performance during the past year. • The trees were much shorter last year. 72 in. Gardener B Gardener A 61 in. 52 in. 47 in. Oak A Age 3 (1 year ago) Oak A Age 4 (Today) Oak B Age 3 (1 year ago) Oak B Age 4 (Today)
We can compare the height of the trees one year ago to the height today. • By finding the difference between these heights, we can determine how many inches the trees grew during the year of gardener’s care. • Oak B had more growth this year, so Gardener B is the better gardener. This is analogous to a Simple Growth Model, also called Gain. 72 in. Gardener B Gardener A +20 in. +14 in. 61 in. 52 in. 47 in. Oak A Age 3 (1 year ago) Oak A Age 4 (Today) Oak B Age 3 (1 year ago) Oak B Age 4 (Today)
… but this simple growth result does not tell the whole story either. • We do not yet know how much of this growth was due to the strategies used by the gardeners themselves. • This is an “apples to oranges” comparison. • For our oak tree example, three environmental factors we will examine are: • Rainfall, Soil Richness, and Temperature. Gardener B Gardener A
High Low Low High High Low Gardener B Gardener A
We can use this information to calculate a predicted height for each tree today if it was being cared for by an average gardener in the area… • We examine all oaks in the region to find an average height improvement for trees. • We adjust this prediction for the effect of each tree’s environmental conditions. • We compare the actual height of the trees to their predicted heights to determine if the gardener’s effect was above or below average. Gardener B Gardener A
In order to find the impact of rainfall, soil richness, and temperature, we will plot the growth of each individual oak in the region compared to its environmental conditions.
Now that we have identified growth trends for each of these environmental factors, we need to convert them into a form usable for our predictions. Now we can go back to Oak A and Oak B to adjust for their growing conditions.
To make our initial prediction, we use the average height improvement for all trees • Based on our data, the average improvement for oak trees in the region was 20 inches during the past year. • We start with the trees’ height at age 3 and add 20 inches for our initial prediction. • Next, we will refine our prediction based on the growing conditions for each tree. When we are done, we will have an “apples to apples” comparison of the gardeners’ effect. 72 in. Gardener B Gardener A 67 in. 52 in. 47 in. +20 Average +20 Average Oak A Age 3 (1 year ago) Oak A Prediction Oak B Age 3 (1 year ago) Oak B Prediction
Based on data for all oak trees in the region, we found that high rainfall resulted in 3 inches of extra growth on average. For having high rainfall, Oak A’s prediction is adjusted by +3 to compensate. Similarly, for having low rainfall, Oak B’s prediction is adjusted by -5 to compensate. Gardener B Gardener A 70 in. 67 in. 52 in. 47 in. +20 Average +20 Average - 5 for Rainfall + 3 for Rainfall
For having poor soil, Oak A’s prediction is adjusted by -3. For having rich soil, Oak B’s prediction is adjusted by +2. 69 in. Gardener B Gardener A 67 in. 52 in. 47 in. +20 Average +20 Average - 5 for Rainfall + 3 for Rainfall + 2 for Soil - 3 for Soil
For having high temperature, Oak A’s prediction is adjusted by -8. For having low temperature, Oak B’s prediction is adjusted by +5. 74 in. Gardener B Gardener A 59 in. 52 in. 47 in. +20 Average +20 Average - 5 for Rainfall + 3 for Rainfall + 2 for Soil - 3 for Soil + 5 for Temp - 8 for Temp
Now that we have refined our predictions based on the effect of environmental conditions, our gardeners are on a level playing field. The predicted height for trees in Oak A’s conditions is 59 inches. The predicted height for trees in Oak B’s conditions is 74 inches. 74 in. Gardener B Gardener A 59 in. 52 in. 47 in. +20 Average +20 Average - 5 for Rainfall + 3 for Rainfall + 2 for Soil - 3 for Soil + 5 for Temp - 8 for Temp _________ +22 inches During the year _________ +12 inches During the year
Finally, we compare the actual height of the trees to our predictions. Oak A’s actual height of 61 inches is 2 inches more than we predicted. We attribute this above-average result to the effect of Gardener A. Oak B’s actual height of 72 inches is 2 inches less than we predicted. We attribute this below-average result to the effect of Gardener B. -2 74 in. 72 in. Gardener B Gardener A +2 61 in. 59 in. Predicted Oak A Predicted Oak B Actual Oak A Actual Oak B
Using this method, Gardener A is the superior gardener. By accounting for last year’s height and environmental conditions of the trees during this year, we found the “value” each gardener “added” to the growth of the tree. This is analogous to a Value-Added measure. -2 74 in. 72 in. Gardener B Gardener A +2 61 in. 59 in. Above Average Value-Added Below Average Value-Added Predicted Oak A Predicted Oak B Actual Oak A Actual Oak B
How does this analogy relate to value added in the education context?