Download
1 / 21
210 likes | 322 Views
A detailed exploration of the chains model for detecting parts based on context, extending from easy reference parts to difficult ones, using face detection to disambiguate hand parts. The method involves preprocessing, modeling posterior probabilities, and conducting exact and approximate inferences. Training and probability estimation are crucial aspects, with the star model as a special case. Application to various object types yields impressive results with promising generalization capabilities. The study presents extensive numerical results for evaluation.

E N D
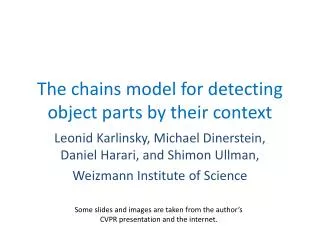
The chains model for detecting parts by their context Leonid Karlinsky, Michael Dinerstein, Daniel Harari, and Shimon Ullman
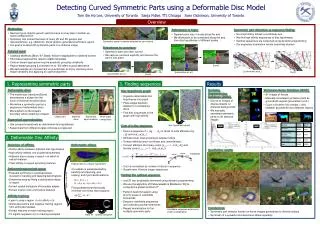
Detects a “difficult” part by extending from an “easy” reference part Detect by marginalizingover chains of intermediatefeatures Goals & Intuition Use the face to disambiguate the hand
Examples & Generality Same approach for any parts of any object!
The chains model M,T • Pre-processing: • Detect the face • Extract features • Modeling the posterior: • Model the probability that hand is in Lh • T – ordered subset of M features • Exact inference: • Sum over all simple chains in the graph • Approximate inference: • Sum over all chains (limit the max. length) • Can be easily computed by matrix multiplication Chains model
Inference M,T voting probabilities = Entry i-j is the marginal over all chains between Fi and Fj = object vs. background likelihood ratios = Chains model
Inference • Instead of full marginalization, MAP inference over C∙S part is done: • For each feature we compute the best chain leading to this feature from head • This feature votes for nearby features
Training & probability estimation Training: • Get example images with detected reference part and target part marked by single point. Non-parametric probability estimation in a nutshell: • Store training image features and pairs of nearby features* in an efficient ANN search structures (KD-trees) • Compute the estimated probability by approximate KDE • E.g.: - search for K nearest neighbors of, compute * use a feature selection strategy (see paper) to reduce the number of features and pairs
Chains & Stars Star model – a special case of “chains” of length one • Limitations of the star model: • Far away features do not contribute. • Features contribute to detection without testing for connectivity with the reference part. star result chains result chains graph
chains graph chains result Feature graph examples chains graph chains result
Buehler et al 2008 – sign language dataset Training: 600 frames of a news sequence Testing: 195 frames from 5 other sequences Our result: 84.9% detection Best in the literature: 79% [Kumar et al, 2009] (avg. over 6 body parts)
Self trained scenario (87%) Person cross generalization scenario (86.9%) Full generalization scenario (73.2%) Buehler et al. 2008 – BBC news dataset (96.8%) Best in the literature: 95.6% [Buehler et al, 2008]
UIUC cars dataset Training: 550 positive /500 neg. Testing: 200 cars in170 images Our result: 99.5% detection Best in the literature: 99.9% [Mutch & Lowe, 2006]
Same approach (same params) works for otherobject types (out of the box) • A single non-parametric model for any object • Detect difficult parts extending from the ‘easy’ parts • Near features vote directly, far features vote through chains • Can be used without the reference part and for full objects Our result:63.1% - 1st max only 90.3% - 1st & 2nd max Summary: detailed numerical results…
Methods Precision-Recall at EER - cars Mutch and Lowe, 2006 99.9% Methods Precision-Recall at EER - horses Leibe et al, 2008 97.5% Shotton et al, 2008 95.7% Lampert et al, 2008 98.5% Gall and Lempitsky, 2009 93.9% Gall and Lempitsky, 2009 98.5% chains model 97.51% chains model (trained on UIUC) 99.5% chains model (trained on Caltech-101 cars) 93.4% 1 – average on 6 upper body partsall except Andriluka et al. and us use tracking all except us use color back…
chains graph* chains result chains graph* chains result Feature graph examples * weights – shown in logarithmic color scale