Download

1 / 15
170 likes | 344 Views
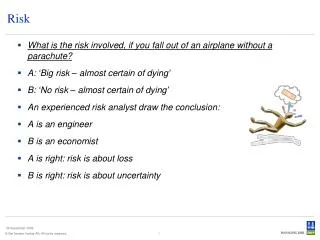
Risk. Certainty v Risk. As human beings, we tend to live mentally in a world of certainty examples Psychologically, that’s usually an illusion. Certainty v Risk. Truth is all situations have some risk

E N D
Certainty v Risk • As human beings, we tend to live mentally in a world of certainty • examples • Psychologically, that’s usually an illusion
Certainty v Risk • Truth is all situations have some risk • Risk can usually be measured in some way and the branch of mathematics that attempts to measure risk is called probability
Certainty v Risk • There are actually three conditions • Certainty • Risk • Uncertainty • Uncertainty occurs when we cannot estimate risk
Random variables • In probability, we look for random variables. • Random variables are numbers whose values we don’t know with certainty. • Examples: expenses, revenues, completion times.
Most likely or expected values • There are several ways to try to work with random variables. • A common approach is to use a most likely or expected value. • We did that with CP/M-based project management
Most likely or expected values • Also, we use this approach frequently in real life. • We use most-likely estimates for • How long it will take us to get somewhere • What an item with “go for” on Ebay • Note that what we might get as a Birthday gift is a guess, but it’s not a most likely value. Random variables are numbers.
Most likely or expected values • A major problem with expected values are they don’t say anything about variability • Example: • If you take 20 minutes to get to school, that’s an expected value • Sometimes you will be early and sometimes late. Sometimes you will be very early and sometimes very late. • How do we get at variability?
What if analysis • Example: linear programming sensitivity analysis • Linear programming assumes certainty, but sensitivity analysis lets us look at what might happen if something happens differently than expected. • Weakness • Bias based on manager’s judgment, so decisions could be better • Burns time: many iterations needed
Probability distributions • A die is a random variable. Roll it and it will have a value. • Roll dice and tally. • The tally represents a model of the risk association with rolling the dice. • Rolling a 2 is riskier than a 7. • Rolling a 1 is impossible. • Models of risk are generically referred to as probability distributions
Probability distributions • Probability distributions are the best available tool for addressing risk.
Excel Random Number Generator RAND() RAND( ) gives you a uniform random number on the interval 0, 1 Pr{RAND( )} 0 1 RAND( )
Using RAND( ) To create a uniform random number between a and b, you can use = a + (b – a) * rand( ) For example, to create a series of numbers between 5 and 12 you would use = 5 + (12 – 5)*rand( )
Using ROUND() • Can be used to round to obtain whole numbers or to specify the number of decimal digits in a number. • Example: round(3.2643,0) gives 3 • Example: round(3.2643,1) gives 3.3