Download
1 / 18
180 likes | 195 Views
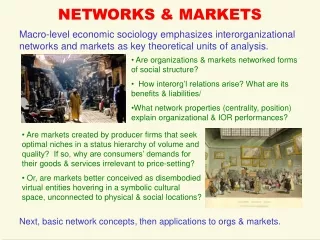
Macro-level economic sociology focuses on interorganizational networks and markets as key theoretical units of analysis, exploring the origins, benefits, and liabilities of such relations. Dive into network properties, markets as social structures, and relational contents in interorganizational settings.

E N D
NETWORKS & MARKETS Macro-level economic sociology emphasizes interorganizational networks and markets as key theoretical units of analysis. • Are organizations & markets networked forms of social structure? • How interorg’l relations arise? What are its benefits & liabilities/ • What network properties (centrality, position) explain organizational & IOR performances? • Are markets created by producer firms that seek optimal niches in a status hierarchy of volume and quality? If so, why are consumers’ demands for their goods & services irrelevant to price-setting? • Or, are markets better conceived as disembodied virtual entities hovering in a symbolic cultural space, unconnected to physical & social locations? Next, basic network concepts, then applications to orgs & markets.
Network Concepts Any small, closed social system may be treated as a complete networkof social relations among a set of actors (persons, groups, or orgs) “Small” = half-dozen to a few hundred actors Ego-centered networkconsists of one focal actor (ego) and its direct ties to a set of others (alters), plus all the links among those alters Work team – a complete network Ego net – friends of ego
Network Relational Contents Diagramming one or more networks in a social systemrequires ego actors to report all the dyadic direct ties (pairwise linkages), of a specific type, that connect them to all other alter actors • A relation is the set of all ties of one specific type, measured for every pair of actors (dyad) in the network • A tie is a direct connection or interaction between a dyad • An absent tie of a dyad can be as relevant as a present tie • Multiple relational contents may connect a dyad Relational content refers to a tie’s substantive meaning, the relatively homogeneous linkages connecting network actors. Varieties of contents, both positive and negative, are potentially unlimited: friendship, work with, play with, advise, consult, lend $, dislike, distrust, house-sit, walk the dog for, ….
Varieties of Network Centrality By interacting, actors come to occupy central positions in communication and exchange networks. A more central location reflects ego’s demand from others (high prestige as a target of popular choices ) and greater reach (access to information, economic, and political resources). • Degree:high volume of direct contacts regardless of “quality” • Closeness:rapid access to & influence over others • Betweenness:mediation of others’ ties (brokerage, s-holes) Bureaucratic hierarchies are asymmetric authority networks (legitimate power) based on command-obey & report-to relations of superiors and subordinates. Betweenness centrality useful to a Machiavellian “player” who can bridge unconnected others. Workteams are egalitarian networks based on advice & trust relationships to build coworker solidarity and boost collective performance. As in dancing and horseshoes, closeness counts.
Interorganizational Networks Interorg’l interactions involve many communication & exchange relations, creating various types of interorganizational networks: ► Spot market transactions ► Relational contracting ► Mergers & acquisitions ► Interlocking board directorates ► Joint ventures & IJVs ► Strategic alliances • Network analysts examine relational contents & structural forms among interconnected organizations. They seek to explain: • Which orgs decide to form interorg’l relations & what types of ties? • What are the patterns of interorg’l communication & resource exchanges in those networks? What density, centralization, etc.? • How do networks shape org’l behaviors & performance outcomes?
Forming Interorg’l Relations At the org’l level of analysis, theories examine interorganizational relations (IOR). Emergent properties arise when nonunitary collective actors interact, exchange, bargain, compete, collaborate, conflict, ... • Network theories try to explain origins and consequences of IOR ties • Requires new theoretical concepts (e.g., governance forms)? • Are IORs simply the aggregation of individuals’ relations? • Do organizations have motives & emotions, interests & goals?Can orgs trust one another, or only people? • How do persons occupying role of organizational agent behave differently than when acting as self-interest individuals? • What cross-level person-organization relations are important?Org’s ties to employees, shareholders, customers/clients
Strategic Alliances • Strategic alliance: An agreement among partnering firms that: • remain legally independent; • share managerial control over performance of assigned tasks; • make resource contributions in strategic areas, e.g., inventing technologies, manufacturing, or penetrating new markets; • agree on how to distribute any benefits resulting from their alliance. Communication networks can facilitate the flow of information among potential partners about alliance opportunities. CEO friendships, board interlocks, professional ties can all serve as intelligence-gathering channels. Because trust among partners is so crucial for success, communicating with partners-of-partners can help to verify past performance or misconduct.
Where Do IOR Come From? IOR originate in combinations of environmental constraints and endogenous network structures that generate new social-economic relations intended to acquire control of resources & maximize org’l performances (profit, R&D innovation, sales,regulatory autonomy) Gulati & Gargiulo’s dynamic model with endogenous feedback loop from present network structure (past alliances, common 3rd parties, joint centralities) to transform future alliances: Relational Embeddedness Structural Embeddedness Positional Embeddedness NETWORKFORMATION Structural Differentiation Strategic Interdependence
Optimizing IOR Benefits • Orgs often cooperate as well as compete with the same orgs. Which network forms optimize an org’s IOR benefits, such as profits, market share, growth, legitimacy, political support? • Network closure – Closely knit ties among org’l set facilitates trust, cooperative exchanges, & collective action; safeguards against information asymmetries & opportunism (deception; “self-interest with guile” - Williamson) • Network diversity – Sparse ties to orgs not linked to current partners span structural holes to gain brokerage benefits, access diverse resources, and learn innovative ideas Contingency H: Alternative forms of IOR networks are better suit to achieving different organizational objectives: (1) Close-knit networks optimize benefits from collaboration (2) Diverse networks optimize appropriation of competitive benefits
An Organizational Field-Net Theory IOR analyses also focus on explaining relational structures at the complete network level, disregarding individual persons or orgs. Kenis & Knoke (2002) combined organizational field with network properties to develop a field-net explanation of aggregate change • Communication ties (info exchanges) are the primary IOR, a necessary prerequisite to future interfirm collaborations • Changes in the communication network’s formal properties (density, centralization) alter opportunities for firms to find available partners • Rates of change vary nonlinearly, initially accelerating with changes in communication network structures, then slowing with saturation or ceiling effects • But, given its heavy longitudinal data demands, how testable is this so-called “theory”?
Networks Change Alliances Changes in the formal properties of an organizational field’s communication network generate nonlinear rates of change in interorganizational tie-formation rates (e.g., strategic alliances): DENSITY RECIPROCITY TIE CONFIRMATION CONNECTIVTY RATE OF STRATEGIC ALLIANCE FORMATION CENTRALIZATION MULTIPLEXITY SUBGROUP COHESION HIERARCHY
Markets from Networks Harrison White developed a sociological model of markets based on producer networks, not neoclassical exchange theory. In Michael Spence’s (1973) signaling game, market actors seek signs of quality in goods and services on offer. In distinguishing good used cars from “lemons,” a dealer with an expensive showroom sends a much stronger signal of her dependability than an owner selling via want-ad. White assumed that firms in a production market will constantly look for signals & clues on what their rivals are doing. Then, one chooses its volume of production to fill market niche y(n) in the quality distribution. Handfuls of large producers socially construct industries, interlinked by the upstream and downstream flows of goods & services. The result is “a production economy with networks of intermediate products and services” that “routinely generate net profits” for all.
W(y) a Duck? In White’s W(y) model, firms play all three market roles in those streams – supplier, producer, purchaser – with uncertainty about future flows making decisions about commitments of production facilities problematic. The many 19th c. Minneapolis flour millers consolidated into today’s few huge global corporate giants (General Mills, Pillsbury) that pay close attention to one another’s strategies for producing cereal, packaged baked goods, bread, & related product lines. White’s math (and dense writing) on the market schedule mechanism W(y) is difficult, but the next figure may be more easy to grasp. W(y) revenue-against-volume profile signals all peer firms about their industry’s stable, socially constructed, status-ranked,quality order. Each firm fits into one of the profile’s niches, enabling production commitments and stable profits: “Firms shelter themselves within the rivalry of a production market.”
Where are Lexus, Chevy, Kia, …? Y (volume shipped) Revenue-against-volume profile is a quality ordering among competitive producer firms, where: y = volume of production; W(y) = total revenue received (“worth”). This pecking order, bundling together structurally equivalent firms & products, is “taken for granted” by each firm in making its production commitments. The quality array also signals the products’ prestige to aggregate buyers. “Existing network ties become folded into and supplanted by relations with a quality ordering, which comes to be perceived in terms of prestige that combines quality for consumption with competitive relations of rivalry.”
Slicing the Market Space The neoclassical exchange market sets equilibrium prices at intersection of the producers’ supply and consumers’ demand for goods or services. But, White’s producers do not know how consumers view their products – only what items sell, in what volumes, & at what prices. Their industry competitors matter most: “Markets are tangible cliques of producers watching each other. Pressure from the buyer side creates a mirror in which the producers see themselves, not consumers.” Using a varying product substitutability parameter (γ), White’s next figure shows the product market space differentiated into five dynamic types: Paradox, Ordinary (Grind), Crowded, and Explosive. Ordinary producers of high-quality goods spend increasingly more in production costs to make a given volume of goods. As more firms crowd into a market, producers move into an explosive-feedback region. Every producer keeps raising its volume, which the market price sustains … until these lemmings plunge over the cliff!
What Are Examples of Each Market Type? Volume dependencies: a/c = contribution/cost Quality variations: b/d = desirability/expense ORDINARY
Sociology of Financial Markets Karin Knorr Cetina rejected White’s org’l approach as too narrow for fully understanding markets in the new knowledge economy. She examined the global microstructures of currency traders, a 24-hour financial market. Their main action is speculation, aimed at profiting from the buy-sell price differentials in spot market exchanges. Global financial markets are “decoupled from networks and exhibit an architecture based on reflexive mechanisms of observation and projection that project market reality and enable it to flow.” (Knorr Cetina 2005:8-9) Drawing from sociology of science, Knorr Cetina used ethnographic methods to expose the Schutzian phenomenology of currency traders’ video screens. She disputes claims that markets (and orgs) are networked forms; rather, they must be seen as “disembodied systems generated entirely in a symbolic space … an icon of contemporary global high-technology culture” (p. 38). What theories could you construct to connect such global reflexive systems (GRSs) to the nonvirtual economics of production and consumption embedded within geographical and social spaces?
References Gulati, Ranjay and Martin Gargiulo. 1999. “Where Do Networks Come From?” American Journal of Sociology 104:1439-1493. Kenis, Patrick and David Knoke. 2002. “How Organizational Field Networks Shape Interorganizational Tie-Formation Rates.” Academy of Management Review 27:275-293.. Knorr Cetina, Karin. 2005. “How Are Global Markets Global? The Architecture of a Flow World.” Pp. 38-61 in The Sociology of Financial Markets, edited by KarinKnorr Cetina and Alex Preda. Oxford, UK: Oxford University Press. Spence, Michael. 1973. “Job Market Signaling.” Quarterly Journal of Economics 87:355-374. White, Harrison C. 2002. Markets from Networks: Socioeconomic Models of Production, Princeton, NJ: Princeton University Press.