Distributed Network Calculations for Large Networks
130 likes | 157 Views
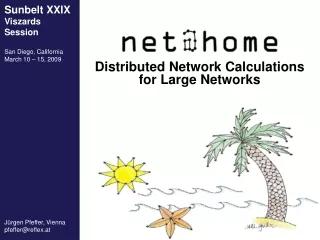
Sunbelt XXIX Viszards Session San Diego, California March 10 – 15, 2009. Distributed Network Calculations for Large Networks. Jürgen Pfeffer, Vienna pfeffer@reflex.at. C B. 659,388 Nodes 16,582,425 Arcs. I. ?. 39 days. Backstory.

Distributed Network Calculations for Large Networks
E N D
Presentation Transcript
Sunbelt XXIXViszards Session San Diego, California March 10 – 15, 2009 Distributed Network Calculations for Large Networks Jürgen Pfeffer, Vienna pfeffer@reflex.at
CB 659,388 Nodes16,582,425 Arcs I ? 39 days Backstory
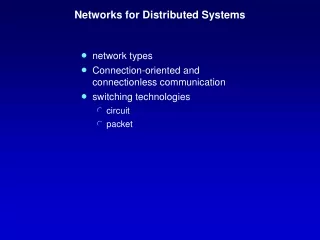
network data is getting bigger and bigger (e.g. U.S. patent, Web 2.0 applications, the internet) the calculation of a lot of network measures need tremendous time for very large networks Scientific Interest
Ulrik Brandes, A Faster Algorithm for Betweenness Centrality. Journal of Mathematical Sociology 25(2):163-177, 2001. all variables reset for each vertex Betweenness Centrality some calculations (breadth-first search) for each vertex s do… for each reachable vertex of s do… increase betweenness centrality by a value
CB[1] CB[2] CB[3] + + + … + CB[4] ... ... CB[N] Betweenness Centrality betweenness centrality for all nodes in the network network withN vertices
1st send the network to all computers:no labels, no attributes to nodes or lines → download is much faster than upload result vector with 659,388 float numbers = 13.5 MB 659,388 x 13.5 MB = 8,693 GB zip: 83.1 GB but, you can sum up partial results:1 user – calculation for 100 nodes -> 0.83 GB → data transfer isn't that big problem when partitioning the calculations smart Data transfer problem
send network to all computers 20-40 iterations: 1 computer does calculation for some nodes upload (small) result vector for some nodes when everything is done: re-download coordinate vector Fruchterman/Reingold Layout Algorithm T. Fruchterman, E. Reingold, Graph Drawing by Force-Directed Placement, in: Software–Practice and Experience, vol. 21, no. 11, pp. 1129–1164, 1991.
network: bookmarktagurl.net:2-mode social bookmark data (V=254,859, E=748,189) 49,750 tags, 205,109 urls main component calculating Fruchterman/Reingold layout algorithm 20 computer participating (at least a little bit) - thanks to you 2 runs: starting position random + circle 40 iterations each rather network art than network analysis Finally some pictures...
Sunbelt XXIXViszards Session San Diego, California March 10 – 15, 2009 Distributed Network Calculations for Large Networks Jürgen Pfeffer, Vienna pfeffer@reflex.at Thanks forthe attention