Download
1 / 49
490 likes | 508 Views
This session presents the draft results of the Quality Assurance Program's analysis of 2006-07 data, showcasing ways to analyze ISIR data and its impact on aid eligibility. It also discusses improper payments in the Pell Grant program.

E N D
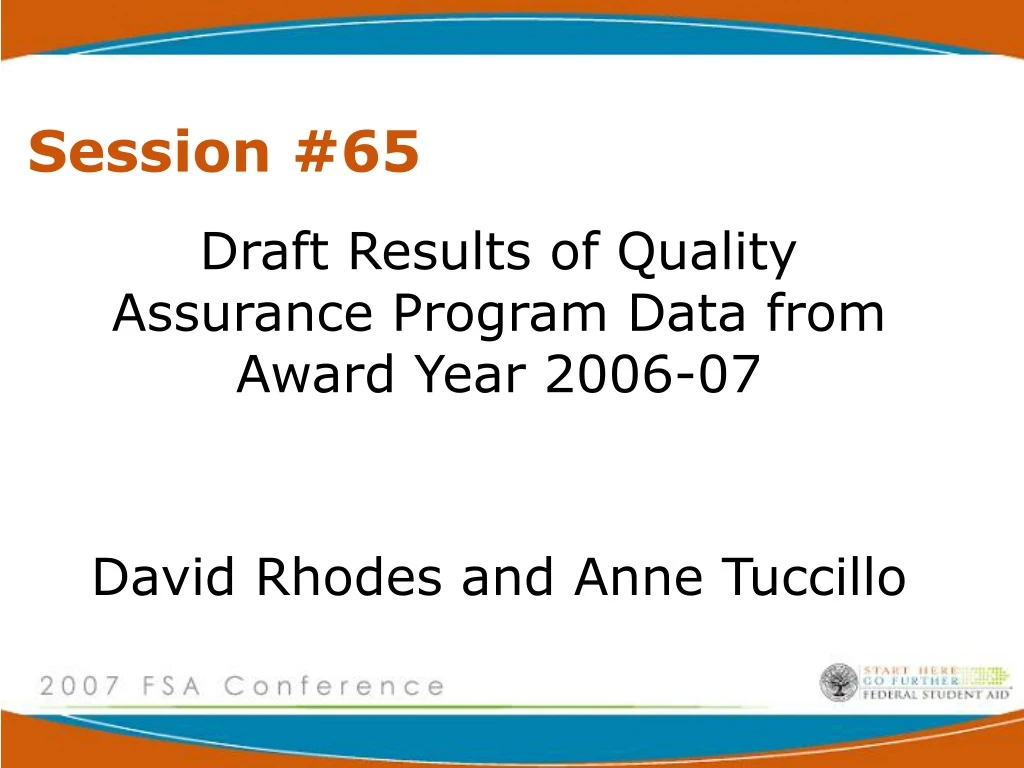
Session #65 Draft Results of Quality Assurance Program Data from Award Year 2006-07 David Rhodes and Anne Tuccillo
Goals • Share draft results of program-wide analysis of 2006-07 data • Illustrate additional ways to analyze ISIR data
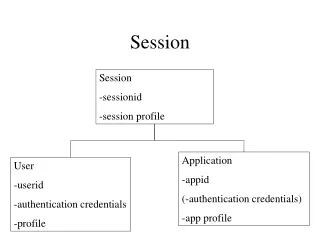
Background • Quality Assurance (QA) Program • Participants granted regulatory flexibility to decide which ISIR data they verify • ISIR Analysis Tool
The 2006-07 Analysis • 146 Quality Assurance Program institutions • Each school drew a random sample of at least 350 applicants • Each school verified the ISIR information for the entire random sample of applicants • We analyzed 68,077 records
See a pattern? • Alternating focus • Random sample of all applicants • Institutionally verified applicants • This year (2007-08) • All QA Program institutions • ISIRS subject to institutional verification
Is analysis over time appropriate? • For individual schools, yes with care • For program-wide analyses the answer “should” be no, but…..
When Looking Across Years Keep in Mind: • The two different populations • Changes to institutional verification criteria between years • Other differences between award years • Percents and averages not counts
Why we “shouldn’t” • QA schools supplying data differ slightly from year to year (146 ≠140 ≠133) • Unmeasured differences in institutional verification across years
Key areas of analysis • Description of population • Critical ISIR fields • How changes affect aid eligibility • Improper payments in the Pell Grant program
Characteristics of Aid Applicants at QA Program Schools 2006-07
Percentage of dependent applicants with changes to the most commonly changed ISIR Fields: 2006-07
Percentage of independent applicants with changes to the most commonly changed ISIR Fields: 2006-07
Changes to critical ISIR fields among dependent students over time
Changes to critical fields among independent students over time
Dependent records: percent of ISIR fields experiencing an EFC change - 2006-07
Independent records: Percent of ISIR fields experiencing an EFC change - 2006-07
Comparison of changes to EFC among dependent students with a change to the indicated ISIR field
Comparison of changes to EFC among independent students with a change to the indicated ISIR field
Percentage of dependent records with a change to the indicated ISIR field and a change to a Pell Grant: 2006-07
Percentage of independent records with a change to the indicated ISIR field and a change to a Pell Grant: 2006-07
Comparison of change to a Pell Grant among dependent students with a change to the indicated field
Comparison of change to Pell Grants among independent students with a change to the indicated field
Average EFC change among dependent records with a change to the indicated ISIR field: 2006-07
Average EFC change among independent records with a change to the indicated ISIR field: 2006-07
Average EFC change among dependent students with a change to the indicated field over time
Average EFC change among independent students with a change to the indicated field over time
Average Pell change for dependent records with a change to the indicated ISIR field: 2006-07
Average Pell change for independent records with a change to the indicated ISIR field: 2006-07
Average Pell Grant change for dependent records with a change to the indicated field over time
Average Pell Grant change for independent records with a change to the indicated field over time
Potential improper payments in Pell Grants prior to verification at QA Schools: 2006-07
Improper Payments in Pell Grants before and after school verification
Improper Payments in Pell Grants before and after CPS verification
Lessons Learned • While verification is crucial in some cases, many ISIR records do not experience a meaningful change from their initial transaction value • QA school verification procedures target larger EFC and Pell changes • QA school verification reduces improper payment risks in Pell
What Do the Findings Mean for Schools and FSA? Given that relatively few ISIR records experience a change that affects eligibility for need-based aid, verification efforts should strive to focus on the records that matter.
Two Ways to Focus • Look for the records that matter • Look for the records that don’t
Look for ways to reduce the number of school verified records that experience no or only trivial changes to aid eligibility after verification Suggested Additional Analysis
Additional Analysis • ISIR Analysis Tool reports • Exporting data from the Tool
ISIR Analysis Tool • Key Filters • EFC change < 400 & EFC change > -400 • EFC change > 400 • EFC change < -400 • Institutional verification criteria
ISIR Analysis Tool • Key Reports • Sample summary • Field Increment (EFC or AGI) • Drill down to refine understanding
New Analytic “Recipe” See handout
Exporting Data See handout
Institutional Profiles Comparison of Program-wide and school specific data
2006-07 Institutional Profile Example of a 2006-2007 Institutional Profile
Profile Differs from Year to Year • 2005-06 provided data of improper payments PREVENTED by institutional verification • 2006-07 provides data on estimated levels of POTENTIAL improper payments in a schools applicant population
Contact Information We appreciate your feedback and comments. We can be reached at: Email: david.rhodes@ed.gov anne.tuccillo@ed.gov