Analyzing Money in American Politics: Insights from the Center for Responsive Politics
The Center for Responsive Politics (CRP), since its inception in 1983, has been the leading organization in tracking the influence of money in U.S. politics. Through its platform, OpenSecrets.org, CRP educates voters about campaign contributions, lobbying activities, and the overall impact of money on elections and public policy. The Center's extensive research caters to citizens, journalists, and academics, providing detailed datasets on political finance. By employing advanced coding systems and data management techniques, CRP ensures that the information regarding political funding is accessible and comprehensible.

Analyzing Money in American Politics: Insights from the Center for Responsive Politics
E N D
Presentation Transcript
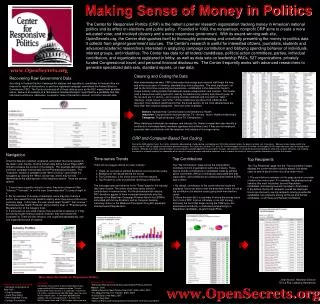
Making Sense of Money in Politics The Center for Responsive Politics (CRP) is the nation’s premier research organization tracking money in American national politics and its effect on elections and public policy. Founded in 1983, the nonpartisan, nonprofit CRP aims to create a more educated voter, and involved citizenry and a more responsive government. With its award-winning web site, OpenSecrets.org, the Center distinguishes itself by thoroughly processing and creatively presenting the money-in-politics data it collects from original government sources. The Center’s research is useful for interested citizens, journalists, students and advanced academic researchers interested in analyzing campaign contribution and lobbying spending behavior of individuals, interest groups, and industries. The Center has data for all federal candidates, political action committees, parties, individual contributors, and organizations registered to lobby, as well as data sets on leadership PACs, 527 organizations, privately funded Congressional travel, and personal financial disclosures. The Center frequently works with advanced researchers to generate specialized data sets, standard reports, or raw data. www.OpenSecrets.org • Cleaning and Coding the Data • After downloading raw data, CRP’s information technology and research staff begin the long and arduous process of cleaning, standardizing, and coding data. The most significant—as well as the most time-consuming and expensive—contribution to the data is the Center’s unique industry coding system that demands human categorization and analysis. The Center uses a hierarchical coding system to classify contributions by industry and interest group. At the top level are 13 sectors—ten covering business interests and one each for "labor," "ideology / single issues," and "other." At the middle level are about 100 industries that represent more detailed classifications than the broad sectors. At the most detailed level are more than 400 industrial categories. Here are some examples: • Sectors: Agribusiness; Communications and electronics; Health • Industries: Crop production and processing; TV / movies / music; Health professionals • Categories: Sugar producers; Cable TV; Chiropractors • When classifying individuals by employer and industry, the Center’s researchers also identify a contributor’s immediate family members (spouses and children) and, if they are not employed, associate their contributions with the employer and industry of the wage-earner. Recovering Raw Government Data According to Federal Election Campaign Act statutes and regulations, candidates for federal office are required to report all transactions to and from registered campaign committees the Federal Election Commission (FEC). The Center downloads all of these data as soon as the FEC makes them available online. Below is an example of a “Schedule A: Itemized Receipts” report filed by a candidate that lists individual contributors, addresses, occupation, date of transaction, amount, and other relevant data. CRP and Computer-Based Text Coding During the 2008 election cycle, the Center anticipates downloading, standardizing, and coding over 25 million records across the dozens of data sets it maintains. Because major media outlets and citizens rely on CRP to rapidly and accurately generate statistics, the Center will use over 70% of its $1.4 million budget—just over $1 million—and roughly 18,000 labor-hours per year to manage these projects. Although the Center already employs many computer-assisted algorithms to accomplish its work, new advances in computer-based text coding will allow it to increase efficiency and reliability, to expand its research capacity to incorporate other relevant research projects and coding schemes, and to improve the quality of money in politics information available to the public. Navigation Once the data are collected, organized, and coded, the Center presents the data in user-friendly, intuitive format using Active Server Page (ASP) format to produce the content of the website. This example demonstrates summary campaign finance data for the Pharmaceutical Industry. The "Industries" section is available under "Who's Giving," users begin the navigation by clicking the "Who's Giving" tab, where they will find themselves at the starting point of the industries section. There are several options. 1. If users have a specific industry in mind, they enter a keyword (like "tobacco," "railroads," or on this case "pharmaceutical") to jump straight to it. 2. For an overview of a range of industries, users may also choose a sector, then select the more specific industry when they arrive at the sector summary page. In this case, the user would select "Health," then choose " Pharmaceuticals/Health Products" at the industry level, or "Pharmaceutical Manufacturing" at the category level. 3. If users are not sure what industry they would like to observe or if they are having trouble finding a specific industry, they can browse the complete list. There are two versions: one organized alphabetically, and one organized by type of industry. Time-series Trends There are four pages offered for every industry: 1. Totals, an overview of political donations over the last ten years 2. Background, the issues behind the money 3. Top Contributors, a list of the donors from the industry 4. Top Recipients, a list of politicians receiving contributions The first page users are taken to is the "Totals" page for the industry they have chosen. The charts show time-series trends in contributions in nominal terms. For the pharmaceutical industry, PAC donations appear to have increased dramatically after the passage of the Bipartisan Campaign Finance Reform Act (BCRA) eliminated soft-money donations and as Congress became extremely active on the Medicare Prescription Drug Bill, especially directed toward Republicans. Top Contributors The "Top Contributors" page shows the total political contributions from organizations within the industry. These figures include contributions to candidates made by political action committees (PACs) or individuals associated with that organization, and contributions to political parties before BCRA was in effect. 1. By default, contributors to the current election cycle are displayed. Users can select from the drop-down menu to look at top contributors for election cycles going back nine election cycles. 2. Above the main list is a summary of where the money came from (from a PAC, from an individual, or via soft money). Following the trend that began during the 1996 cycle, the pharmaceutical industry contributed overwhelmingly to Republican candidates, largely through PACs. Top Recipients The "Top Recipients" page, like the "Top Contributors" page, displays the current election cycle by default, but allows users to search back in time via a drop-down menu. 1. The contributions summary on this page gives an overview of where the money went. For example, the pharmaceutical industry (like most industries) favored Republican candidates, and heavily favored incumbent officeholders. 2. By default, the top 20 recipients overall are displayed. Users can choose to see top recipients among presidential candidates, top recipients among all House and Senate candidates, or all House and Senate incumbents. More About the Center for Responsive Politics Jihan Andoni, Research DirectorTim La Pira, Lobbying Researcher • Awards & Recognition • American Political Science Association Best Political Science Website: 2000 • Webby Award for Best Politics Site: 2007, 2006, 2002, 2001 • PC Magazine Top 101 “Classic” Sites: 2007 • Forbes Best of the Web: 2007 • Yahoo! Daily Pick • National Press Club Distinguished Contribution to Online Journalism Web Traffic On Election Day in 2006, traffic to OpenSecrets.org surpassed the 2004 presidential election. The site received the most hits ever in a single day—more than 2.3 million—and delivered 436,000 page views to nearly 45,000 unique users. In the week preceding the election, the site averaged nearly 1.5 million hits, 366,000 page views and 27,000 unique visitors per day. • Major Foundation Funding • Carnegie Corporation of New York • Ford Foundation • Joyce Foundation • Pew Charitable Trusts • Sunlight Foundation www.OpenSecrets.org