Download
1 / 11
110 likes | 266 Views
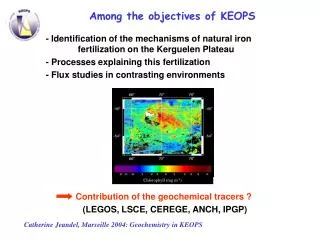
Chlorophyll Results. Ocean Optics 2004 Mike Sauer & Eric Rehm. Sources of [Chl] Variability. Spatial Different Dock locations Dock vs. Buoy Temporal Different sampling days / times Fluorometer sample & BB2F measurements made at different times Diel Cycle differences Tidal influences

E N D
Chlorophyll Results Ocean Optics 2004 Mike Sauer & Eric Rehm
Sources of [Chl] Variability • Spatial • Different Dock locations • Dock vs. Buoy • Temporal • Different sampling days / times • Fluorometer sample & BB2F measurements made at different times • Diel Cycle differences • Tidal influences • Sample • Sub-sampling technique • Filtration volume for spec was constant = 400 ml • Calibration of instruments • Chlorophyll / aΦ ratio • Spec path length amplification correction ( or C&W) • Wavelength • E.g., Spec data is at 675 nm • Local Amax • Other sources?
BB2F Chlorophyll Note: Water sampled different time than other measurements
Chlorophyll / aΦ ratio @ 676 nm Boss, et al., JGR, 2004, “Particulate backscattering ratio at LEO 15 and its use to study particle composition and distribution” “… relationship developed by C. Roesler (personal communication, 2000). … This relationship derives the chlorophyll concentration (mg/L) by dividing its absorption by a chlorophyll specific absorption at 676 nm assumed to be of 0.014 mg/L/m. This relationship has been found to have a close fit with chlorophyll a obtained through traditional extraction methods with data off the Oregon coast (r2 = 0.98, where r2 denotes the square of the correlation coefficient) (L. Karp-Boss, personal communication, 2001).”
Chlorophyll / aΦ ratio @ 676 nm • This is an estimated relationship based on data set from Oregon coast: [Chl] = aΦ(676) / .014 (μg / L) • Chlorophyll / aΦ ratio • Used .014, as per lab handout • In reality, range = .008-.023 depending on phytoplankton packaging (more packaging, smaller ratio, smaller phy tend to have less packaging, large phy near surface tend to have more packaging). • Think: do you really need a [Chl] measurement? • Could we model a better value based on the g we estimate from Cp?
Variability of [Chl] between BB2F and (Spec, AC-9, Fluorometer) • We are looking at : • Variability between sampling times and • Variability between instruments
Variability of the BB2F [Chl] • Observatory vs. Handheld • Different sampling locations • Metal piling was dumping water stream one day • Relied on Wetlabs calibration data • No cross-calibration between instruments
Spectrophotometer Method • We used the QFT technique • Possible problem: Smaller particles reflect (backscatter) more light, overestimating absorbance.
Spectrophotometer Method • T-R (Transmittance-Reflectance) Method • Integrating sphere attached to dual-beam spec • Uses a model that eliminates the effect of light backscattering by the particles. • “Studies have shown that values of path-length amplification were less widely dispersed in the case of the T-R method”Lohrehnz et al., Journal of Phytoplankton Research, 25/1, p35-61, 2003“Phytoplankton spectral absorption as influenced by community size structure and pigment composition” • “…particularly suited for applications to samples containing highly scattering mineral particles that are commonly found in Case 2 waters.” Mitchell et al., Ocean Optics Protocols for Sat Ocean Color Sensor Validation Rev. 4, 2003, Chapter 4“Determination of spectral absorption coefficients of particles, dissolved material and phytoplankton for discrete water samples”
Data Management & Organization • Data and metadata are separated • Data: Spec and AC-9 data in computer files • Metadata: Sample time, location in notebooks, typ. not on-line • Suggestion: Include Metadata in Matlab, e.g. Metadata = ‘Data collected 7/1/2004, 10:00:00 EDT by Eric Rehm’ • Data and script storage locations vary • Some groups stored on shared server • Some groups stored on individual laptops (only some data and scripts made it ot the server) • Suggestion: All groups store all data and all Matlab scripts on server, rather than on individual laptops • MATLAB file format annoyances • Not backward compatible by default (V6.5 vs. V7.0) • Workaround: save –v6 • Spaces in directory names are a pain in the ….