Download
1 / 18
180 likes | 258 Views
On the Evaluation of Incentive Structures to Implement Off-Hour Deliveries. Felipe Aros -Vera Researcher arosvm@rpi.edu Jose Holguin- Veras , Ph.D., P.E. William H. Hart Professor VREF’s Center of Excellence for Sustainable Urban Freight Systems

E N D
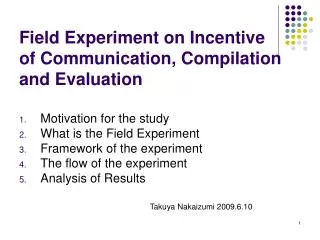
On the Evaluation of Incentive Structures to Implement Off-Hour Deliveries Felipe Aros-Vera Researcher arosvm@rpi.edu Jose Holguin-Veras, Ph.D., P.E. William H. Hart Professor VREF’s Center of Excellence for Sustainable Urban Freight Systems Center for Infrastructure, Transportation, and the Environment Rensselaer Polytechnic Institute jhv@rpi.edu
Motivation Traffic Congestion Supply Perspective Transportation Demand Management
Motivation • TDM has primarily focused on passengercars • Regrettably: the role that TDM could play on freight has been overlooked
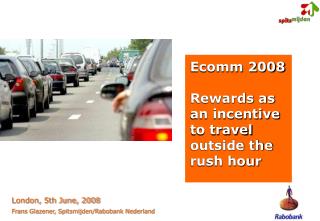
Off-Hour Deliveries • An important freight TDM measure involves the use of public sector incentives to induce a change in delivery times from the regular to the off-hours (7PM to 6AM). • Complexity: Delivery time!!! Behavioral Micro-Simulation (BMS)
Behavioral Micro-Simulation (BMS) • Objective: simulate the carriers’ and receivers’ joint decision process to evaluate TDM policies • Features: deep behavioral foundation embedded in the decision making process followed by carriers and receivers • Fundamental insight: in order for OHD to be implemented, both carriers and receivers have to be better off
a) Base case (no OHD) b) Mixed operation Overall process of the BMS Define range of incentives to receivers for OHD • Carrier/receiver synthetic generation • Randomly select industry segment • Generate/locate carrier • Generate/locate receivers to serve Legend: • Receiver behavioral simulation • Model receiver’s decision to accept OHD Carrier depot Regular-hour receiver Ordinal logit model (Holguin-Veras et al 2013) Off-hour receiver • Carrier behavioral simulation • Compute costs for base case and mixed operation • Model carrier’s decision Repeat for another carrier-receivers set Change incentives, reset participation counts End Output: Truck Trips Market Share Receivers Market Share
Ordered logit model with random effects • This model reproduces receivers’ response to incentives Incentives NAICS code Interaction terms:OTI and NAICS Interaction terms:TV and NAICS
Case study: New York City • The island of Manhattan is the economic center of a large metropolitan area of a total population of 20 million with NYC, and its eight million residents, as its center
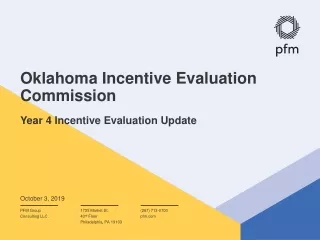
Case study: New York City • 3 different incentives are evaluated • Business support (BS) • Public recognition (PR) • One time incentive (OTI) • Data: • New York Metropolitan Transportation Council (NYMTC) Best Practice Model (BPM): demand model for the NY metropolitan area
Use of the NYMTC Best Practice Model • Origins (NJ) • Destinations (businesses) in Manhattan • Industry sector (NAICS) determines: • Number of stops • Location of businesses
BMS Results • OTI = $4,000 • avg = 3.4% • max = 7.6% • min = 1.3% • OTI = $2,000 • avg = 2.7% • max = 7.6% • min = 1.2% • OTI = $6,000 • avg = 4.3% • max = 9.9% • min = 1.9% • OTI = $8,000 • avg = 5.5% • max = 11.9% • min = 2.6% • OTI = $10,000 • avg= 7.0% • max = 13.4% • min = 3.5%
Results: incentives and impact on OHD • OTI of $1,000 + BS + PR would move more than 2,300 deliveries to the night hours; this corresponds to a reduction of 2% of deliveries. Budget of $2.4 millions • If the incentive reaches $10,000, more than 8,000 deliveries could be moved to the night. Budget of $70 million • Each delivery is estimated to take between 45 and 90 minutes in the regular hours (pilot tests show delivery times of less than 30 min during OHD)
Results: geographic oriented incentives • One of the most remarkable results comes fromgeographic oriented incentives • The most congested parts of the city; lower and midtown Manhattan, has the largest economic and social benefits • OTI of $10,000, requiring $36 million, could move around 4,100 deliveries, similar numbers than giving incentives to the entire city with the exception that these deliveries are made in the most congested part of the city
Conclusions • The BMS is an important tool for evaluating TDM policies; in this case the set of incentives to foster Off Hour Deliveries • The application to the Manhattan case study provides significant insight into the potential benefits, and limitations: • Off-Hour Deliveries • Geographic oriented incentives • Self Supported Freight Demand Management