Download
1 / 63
630 likes | 737 Views
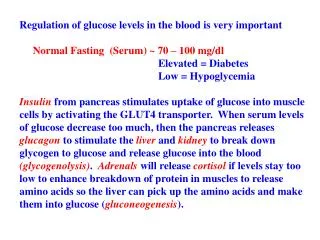
Glucose regulation in the ICU using a computerized algorithm. R.J. Bosman. 1995. “Hyperglycaemia is beneficial by promoting cellular glucose uptake….” “A glucose concentration of 9-11 mmol/L … recommended and acceptable..”. Mizock BA.

E N D
Glucose regulation in the ICUusing a computerized algorithm R.J. Bosman
1995 “Hyperglycaemia is beneficial by promoting cellular glucose uptake….” “A glucose concentration of 9-11 mmol/L … recommended and acceptable..” Mizock BA. Alterations in carbohydrate metabolism during stress: a review of the literature Am J Med. 1995 Jan;98(1):75-84
2001 Mizock BA. Alterations in fuel metabolism in critical illness: hyperglycaemia. Best Pract Res Clin Endocrinol Metab 2001;15(4):533-51.
IC mortality 8.0 vs 4.6% first 5 days in IC 1.8 vs 1.7% > 5 days in IC 20.2 vs 10.6% G vd Berghe et al NEJM 2001: 345: 1359-67
Van den Berghe - 2001 Strict control of blood glucose in critically ill patients (4,4 - 6,1 mmol/L) confirmed a number of benefits: • lower mortality • reduced ICU stay • lower incidents of bacteraemia
insulin - gluconeogenesis glycogenolysis glucose uptake + + + + glucagon cortisol growth hormone catecholamines cytokines immobilization Glut-4 mechanisms of hyperglycaemia acute phase of critical illness hyperglycaemia
mechanisms of injury / protection • endothelium / NO pathways?
+ - - + + + + - - + + - + + + + + + - - + + Langouche et al.J Clin Invest. 2005 August 1; 115(8): 2277–2286. doi: 10.1172/JCI25385.
conventional intensive insulin mechanisms of injury / protection Langouche L et al J Clin Invest. 2005 August 1; 115(8): 2277–2286. doi: 10.1172/JCI25385.
mechanisms of injury / protection • endothelium / NO pathways • reduced defense mechanisms • polymorphonuclear neutrophil dysfunction • decreased intracellular bactericidal activity • decreased opsonic activity
mechanisms of injury / protection NADPH NADP+ A Perner et al ICM 2003: 29: 642-5
mechanisms of injury / protection NADPH NADP+ 6PGluconate Glucose G6PDH G6P NADP A Perner et al ICM 2003: 29: 642-5
mechanisms of injury / protection NADPH NADP+ 6PGluconate Glucose G6PDH G6P NADP A Perner et al ICM 2003: 29: 642-5
conventional intensive insulin mechanisms of injury / protection • endothelium / NO pathways • reduced defense mechanisms • anti-inflammatory effects • through NF- k regulated pathways • lower CRP level in intensive insulin group
mechanisms of injury / protection • endothelium / NO pathways • reduced defense mechanisms • anti-inflammatory effects • insulin itself: • anabolic effect • through PI3K pathway cell proliferation • anti-apoptotic effect
more strict regulation required • feasibility? • May 2002 POC glucose measurement on IC • 2x Accucheck • all 120 nurses trained • renewed interest for regulation
Sept/Oct 2001 Nov/Dec 2001 Jan/Feb 2002 Sept/Oct 2002 no of patients admitted at the ICU 322 319 322 347 no of glucose measurements 2770 2881 3163 3832 no measurements per patient mean glucose (median) % of patients treated with insulin no hypoglycaemic incidents (< 2.5 mmol/l) Total amount of insulin administered (IU) several attempts….
Sept/Oct 2001 Nov/Dec 2001 Jan/Feb 2002 Sept/Oct 2002 no of patients admitted at the ICU 322 319 322 347 no of glucose measurements 2770 2881 3163 3832 no measurements per patient 9 9 10 11 mean glucose (median) 10,2 (9.5) 10,1 (9.5) 9,7 (9.1) 9,8 (8.9) % of patients treated with insulin no hypoglycaemic incidents (< 2.5 mmol/l) Total amount of insulin administered (IU) several attempts….
Sept/Oct 2001 Nov/Dec 2001 Jan/Feb 2002 Sept/Oct 2002 no of patients admitted at the ICU 322 319 322 347 no of glucose measurements 2770 2881 3163 3832 no measurements per patient 9 9 10 11 mean glucose (median) 10,2 (9.5) 10,1 (9.5) 9,7 (9.1) 9,8 (8.9) % of patients treated with insulin 24 37 67 69 no hypoglycaemic incidents (< 2.5 mmol/l) 0 2 7 18 Total amount of insulin administered (IU) 10198 16416 20974 35346 several attempts….
‘free’ approach failed • glucose must come down • ‘free’ approach failed • guideline • more frequent measurements: • result directly available • short treatment loops
guideline? guideline requirements • glucose in target range (4-7 mmol/L) • reduce hypoglycaemia’s • no fixed interval of measurements • clinical acceptance
guideline? it ain’t simple…
guideline? guideline
study two main topics: • adherence to the guideline • glucose regulation
whyadherence? guidelines • reduce large variations and inequities in clinical care • contribute to improved outcome • low adherence
why adherence? low adherence to guidelines • knowledge barriers • attitude barriers • behavioral barriers
study two main topics: • adherence to the guideline • glucose regulation
glucose regulation glucose regulation • defined 5 ranges : • too low < 2.5 mmol/l • low 2.5 – 4.0 mmol/l • normal 4.0 – 7.0 mmol/l • high 7.0 – 8.5 mmol/l • too high > 8.5 mmol/l
glucose regulation glucose regulation • not number of measurements • time in each range
1 measurement too high 20%? too high: > 8.5 high: 7.0 - 8.5 normal: 4.0 – 7.0 low: 2.5- 4.0 too low: < 2.5 glucose regulation why time? 5 glucose measurements high: 2* 3 minute = 6/1440 = 0.4 % too high: 54 minutes = 54/1440 = 3.75% Le Floch JP, Escuyer P, Baudon D, Perlemuter L. Blood glucose area under the curve. Methodological aspects. Diabetes Care. 1990;13:172–5
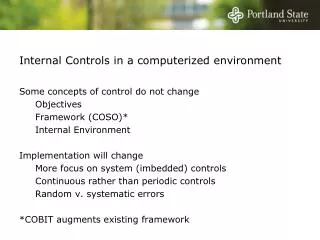
clinical setting • 18 beds - closed format ICU • non-academic teaching hospital • 1900 admissions per year • 1100 cardio-thoracic surgery • information processing fully computerized since April 2001 with MetaVision (iMD-Soft)
research design • before – off – on - off design • before guideline implementation • paper implementation (off) • intervention (on) • post-intervention: only paper (off) • all patients admitted to ICU are eligible • randomized based on PatientID
research design • guideline activation • expected LOS > 24 hours • diabetes • exclusion criteria • induced hypothermia • Glucose/Insulin/Potassium infusions • ingestion of normal meals
research design primary end points: • improve adherence to the guideline • improve time in normal range (4 – 7 mmol/L) • reduce number of hypoglycaemic incidents
intervention • computerized algorithm • Decision Support Software • (Event manager – MetaVision iMD-Soft) • timing of glucose measurements • adherence to insulin advice in guideline
Insuline has already been reduced to 2.2 ml/h Check next glucose after 1 h ( 14h)
technical realization client display client VB application server Event Manager
technical realization client display client VB application server Event Manager
technical realization client display client VB application server Event Manager
technical realization client display client VB application server Event Manager
technical realization client display client VB application server Event Manager
results • guideline adherence • timing: next glucose measurement taken on time? • insulin advice: advice provided by guideline executed? • glucose regulation • time in range • mean glucose values • hypoglycaemic incidents
results: guideline adherence timing of glucose sample
results: guideline adherence insulin advice followed
results: glucose regulation % time in range Rood E, Bosman RJ et al JAMIA, 2005; 12(2): 172-180
results hypoglycaemic incidents
how to further improve guideline • diabetic patients • corticosteroids