Download
1 / 17
170 likes | 233 Views
Regression analysis and correlation are statistical techniques used to quantify the relationships between variables. Learn how to analyze data, interpret results, and understand the significance of correlation coefficients.

E N D
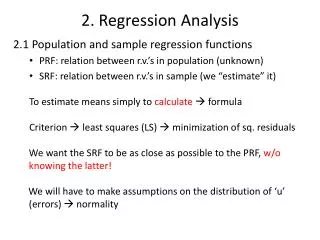
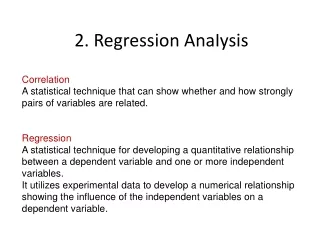
2. Regression AnaIysis Correlation A statistical technique that can show whether and how strongly pairs of variables are related. Regression A statistical technique for developing a quantitative relationship between a dependent variable and one or more independent variables. It utilizes experimental data to develop a numerical relationship showing the influence of the independent variables on a dependent variable.
Correlation Scatter plot: graphical representation of the relation between two or more variables. positively stronger negatively weaker noncorrelation
Covariance: statistical measure of the degree to which the two variables move together Correlation coefficient: is a measure of the strength of the relationship between the variables. (Pearson's correlation)
The type of relationship is represented by the correlation coefficient: • r =+1 perfect positive correlation • +1 >r > 0 positive relationship • r = 0 no relationship • 0 > r > -1 negative relationship • r = -1 perfect negative correlation
Significance test for correlation Null hypotesis: H0: r = 0 alternative hypotesis: H1: r ≠ 0 r: population correlation The test statistic is t-distributed with n-2 degrees of freedom
Example 2-1. A study is designed to check the relationship between smoking and longevity. A sample of 15 men 50 years and older was taken and the average number of cigarettes smoked per day and the age at death was recorded, as summarized in the table. Can we conclude from the sample that longevity is independent of smoking? H0: r = 0 2.16 < 3.67 so we reject the null hypothesis, and conclude there is a correlation between smoking and longevity: increased levels of smoking reduces longevity.
Regression In chemical engineering, regression may be applied to correlating data in a wide variety of problems, ranging from the simple correlation of physical properties to the analysis of a complex industrial reactor. For example, in a reactor regression methods have been used to develop an equation relating yield of desired product to entering concentrations, temperature, pressure, and residence time. If nothing is known from theory about the relationship among the variables, a functionmay be assumed and fitted to experimental data. Frequently a linear function is assumed.
Linear Regression (fitting a straight line) x is the independent variable Y is the true (theoretical or expected) value of the dependent variable Y is a function of x, e.g. for linear regression: Y(x) is the assumed functional relationship with b0, b1parameters y is the measured dependent variable value e is the measurement error estimation for Y(x)
The problem is toobtain estimates b0 and b1 from thesample for the unknown parameters b0 and b1. This can best be done by the method of least squares. This method minimizes thesum of squares of the differences between the predicted values and the experimentalvalues for the dependent variable. SSE: error sum of squares or residual sum of squares
To determine the minimum, the partial derivative of the error sum of squareswith respect to each constant is set equal to zero:
The solutions to these normal equations are: The estimator b1 can also be written in the form:
Sum of squares SST = SSE + SSR SST: total sum of squares SSE: error sum of squares or residual sum of squares SSR: regression sum of squares
Coefficient of determination SST = SSE + SSR The coefficient of determination, R2, is the percentage of variation in the dependent variable explained by the independent variable.
Excel Results sr: residual standard deviation Confidence interval for b0 and b1. It tests whether b0 (the intercept) is zero. It tests whether b1 (the slope) is zero.