Download
1 / 45
450 likes | 614 Views
E-Science, the GRID and Statistical Modelling in Social Research Rob Crouchley Collaboratory for Quantitative e-Social Science University of Lancaster. Contents. The Problem/Motivation: Some Background on Statistical Methods and Social Research;

E N D
E-Science, the GRID and Statistical Modelling in Social Research Rob CrouchleyCollaboratory for Quantitative e-Social Science University of Lancaster
Contents • The Problem/Motivation: Some Background on Statistical Methods and Social Research; • A Solution to part of the Problem? GRID Enabling the Analysis of Multiprocess Random Effect Response Data • Questions.
Part 1. Some Background onStatistical Methods and Social Research • Some Features of Social Science Research • Complications • A computationally demanding example • Sabre and Stata/MP
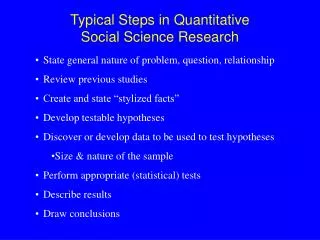
Some Features of Quantitative Social Science Research • We often want to develop evidence basedsubstantive theory. We want to know “what determines what”, e.g. long term unemployment and social exclusion • And we want to explore the consequences ofpolicy changes on individual behaviour, e.g. encouragement to stay on at school on educational attainment, truancy, and social exclusion • Our data sets are often very small (<10GB)
Social Science Research • Randomised experiments offer the most powerful tool to understand social processes, but outside of psychology, they are infeasible, unethical or inappropriate (e.g. for instance we can not allocate pupils to different levels of education); • Social scientists must therefore rely on observational data from longitudinal and other surveys e.g. YCS, NCDS, BHPS, The analysis of non experimental data involves complications..
Complication 1. Cluster Effects (CE) • Most large scale surveys use multi-stage sample designs to obtain 'representative' samples; this procedure often creates cluster effects, e.g. BHPS (households), YCS (schools); • Pupils in the same class are often more behaviourally alike than pupils in different classes (even in the same school)
Complication 1. Cluster Effects (CE) • Procedures have been developed to model cluster effects by means of shared random effects - MLwiN, Stata (Gllamm), SAS, AML; • The estimation of non-identity link (and non nested CE) models, e.g. probit, can be computationally demanding;
Complication 2. Measurement Errors (ME) • In observational studies, it is rarely possible to measure all relevant covariates accurately, e.g. age, educational attainment; • Ignoring ME can seriously mislead the quantification of the link between explanatory and response variables; • ME in one covariate can bias the association between other covariates and the response variable, even if those other covariates are measured without error;
Complication 2. Measurement Errors (ME) • Also, some important determinants of behaviour are either not measured (i.e. omitted) or are unmeasurable (e.g. motivation); • Repeated measures and longitudinal data provide the opportunity to deal with ME in explanatory variables, this adds to the computational demands of the analysis.
Complication 3.Missing Data, Dropout and Selection • All of the major longitudinal data sets available to the British social science community, (e.g. YCS, BHPS and NCDS), contain missing data and dropout; • Ignoring this could create bias in the model estimated on the data; • We need to model, as realistically as possible, the process by which the observed subjects have been retained in the sample, otherwise we will not know how much bias is present in our results; • Also, some sample designs create selection effects of their own, e.g. by using a subset of locations, or oversampling the poor; • These add to the computational demands of the analysis.
Complication 4.Parametric Assumptions • Our statistical tools are assumption rich: • Parametric linear predictors, • Parametric link functions and error structures; • What if the assumed parametric relationships do not hold? • BUT -Nonparametric statistical models are computationally intensive.
Complication 5.Endogenous effects • The curse of endogenous effects, everything seems to depend on everything else; • We need multiprocess models (simultaneous equations) to disentangle this complexity, adds to computation;
Disentangling complexity with existing tools: an exampleendogenous effects • The YCS is a multi-stage stratified clustered random sample of individuals ages 16-17; • I use YCS6 which covers young people eligible to leave school in 1990-91, who are then observed over the 1992-94 period.
Part-time workandtruancyare potential determinants ofeducational attainment A comprehensive model will allow us to disentangle the observable, direct, effects of truancy on educational attainment from any effects that arise from correlation in the errors (unobserved effects).
Trivariate Ordered Probit Model(Path Diagram) Independent Errors (ep, et, eq) Part-time work Educational Attainment Truancy
Independent Errors(ep, et, eq) • This model is quick (1-2 seconds) to estimate, 3 linear predictors: - Probit for PT work, - Ordered Probits for Truancy and Qualifications; • We can use standard software, e.g. Stata.
Problems and Model Extensions • Cant use standard software to fit the model via MLE; • I used NAG software library, it has special routines to evaluate high dimensional multivariate normal integrals; • Even so, this Model can take 2-3 weeks to estimate on a P4, 3 linear predictors, 169 parameters, 8,496 trivariate integrals for each function evaluation; • Results from this model are quite different to those estimated under independence; e.g. one direct effect changes sign, another becomes NS;
What is happening? • Evaluating lots of 3 dimensional integrals in order to compute our likelihood functions is computationally demanding; • We could: Try other methods for evaluating integrals such as Gibbs sampling and MCMC, Use approximations: Laplace expansions with many terms Pseudo and Quasi Likelihood Methods Estimate fixed effects versions of the models; Use Instruments for the endogenous covariates All can be computationally demanding, and each approach has its own problems;
If we want to go this way, what can we do? • Use parallel algorithms on the Grid • Use faster Hardware, e.g. HPCx, (also part of the Grid) • Both
In the education example I’ve assumed • Particular directions for the direct effects • No Non Ignorable dropout in the YCS • No School Cluster effects present • MVN Error structure • Linear predictor, additive function • No measurement error in observed covariates We do not yet have the computational power (on the GRID) to relax all the assumptions simultaneously in this model.
SABRE – Software for the Analysis of Binary Recurrent Events • What is it ? • Programme for analyising multivariate binary, ordinal, count and recurrent events data. Employs fast numerical algorithms. Uses Gaussian Quadrature and NPMLE for the REs • Some typical application areas. • Infertility in humans, animal husbandry. • Voting, trade union membership, economic activity and migration. • Absenteeism studies.
SABRE Why use it ? >6 months >1 week Data is administrative records covering the duration in employment in the workforce of a major Australian state government to investigate the determinants of quits and separations amongst permanent and temporary workers. NP base line hazard, quadrature for the REs
What about SABRE and Stata/MP • Stata/MP is 1.7 times faster on 2 processors • Stata/MP is 2.8 times faster on 4 processors • Stata/MP is 4 times faster on 8 processors • Sabre can have a bit faster speedup, but the big difference is probably the base from which Stata/MP starts. Using the previous example on our HPC we could have (in minutes)
An empirical analysis of vacancy duration using micro data from Lancashire Careers Service over the period 1985–1992, NP base line hazard, quadrature for the REs
What have I said so far? • That the estimation (via maximum likelihood) of some statistical models can be very computationally demanding and beyond what you can usefully do on your desktop.
Ways of running Sabre on the GRID • Directly via the operating system, e.g. Globus • Via a Portal, e.g. Science Gateway • Via a desktop application, like the tip of an iceberg (I’m going to concentrate on this for the rest of the talk)
Using the Grid Via a Desktop Application • Separation of Client and Server Logic • Why ? • Implementation of Service Logic may change to allow for improved algorithms, models or scheduling policies and so on • However, user interface stays the same!!
Client Client Client Client First Tier Second Tier Configuration GROWL Server Agent Agent Agent Agent Third Tier Services
Example: Using Sabre on a GRID from Stata • User gets a Stata plugin (unzip it in the users ado directory) • This adds some items to the Stata menus • And provides a series of dialogue boxes
GROWL SERVICES • Could contain lots of other software, e.g. MCMC software on the Grid • Could use lots of different systems, NGS, NWG, etc
SABRE – Availability and Support • Web Site http://sabre.lancs.ac.uk • Full Command Documentation • Tutorials • Example Data • Publications • Downloads • “SabreR” binary R packages including documentation (end 06/2006) • “SabreStata” Stata plugin including documentation (end 07/2006) • Sabre source code
What have I said in part 2 . • There are beginning to be some tools that can make a lot more resources (Grid) available to you from within desktop applications.
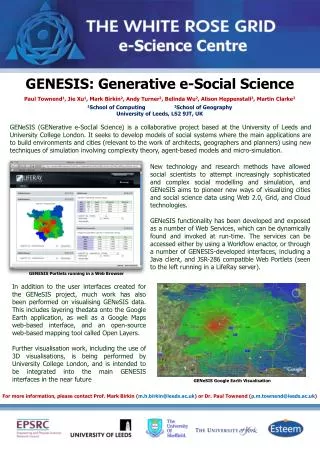
Grid Resources On Workstation Library www.growl.org.uk SABRE Software for the Analysis of Binary Recurrent Events www.sabre.lancs.ac.uk Lancaster’s Statistical Software for e-Social Scientists SABRE SABRE + R SABRE+ R+GROWL SABRE is a program specifically designed for the analysis of binary, ordinal, count recurrent events as are common in many surveys. SABRE’s dedicated soft-ware ensures fast response times. Adding SABRE as a plug-in to R allows Sabre commands to be processed from the R user interface. Configuration of models and preparation of data is then undertaken using the extensive functionality of R Using GROWL Components, SABRE commands invoked in R are executed in parallel on the GRID, making SABRE an excellent e-Social Science tool. R Commander Application area’s • Studies of infertility in humans. • Animal husbandry. • Absenteeism studies. • Clustered sampling schemes. • Studies of voting behavior, trade union membership, economic activity and migration. • Demographic surveys. The familiar R interface is being maintained by using SABRE as a plug in Acknowledgements: Sabre was originally developed by Lancaster University’s Centre for Applied Statistics, further development and use cases have been funded by the EPSRC, and ESRC as part of the NCeSS CQeSS node • Mover stayer models, conventional logistic, logistic-normal and logistic-normal with end-points models to binary data. • Ordered probit and logit random effect response models. • Fits conventional log-linear, log-linear normal and log-linear normal with end-point models to count data. • Substantial control is available over the parameters of the algorithm for the sophisticated user. • Very long sequences of data. • Multi-process data, where each response sequence is of a different type, limited to the simultaneous analysis of trivariate correlated sequences. • Capable of running in a parallel computing environment R Commander Invoking a computational intensive and parallelised method on a Grid Sabre can be added as a library to R so that R is menu driven, rather than command driven. This makes R easier to use. OGSA Local O/S e.g. workstation R Program Componentised Parallel Algorithm SABRE Specifications OGSA client invoked as a method call Remote O/S, e.g. parallel computer e-science. lancs.ac.uk/cqess/ Grid Resources on Work Stations GROWL employs a client/server architecture that hides the complexity of GRID middleware from the user. Client access to GROWL employs a secure (PKI/SSL) connection to a single port on the host system and clients are authenticated using the distinguished name extracted from their certificate. The use of a persistent server to access grid resources allows all of the service logic to be hosted by the server, making the client application, library or plugin extremely lightweight. Future developments • Course material for the use of Sabre is currently being developed. • It is planned to launch a Sabre/GROWL service on the North West Grid within the coming year. This will provide a utility based grid resource. • Research into labour markets using Sabre/Growl. • SABRE will become available as a plug in for STATA Further information: http://www. sabre.lancs.ac.uk Middleware for e-Social Science Development of a parallel, multilevel, multi-process (OGSA) implementation of SABRE as an R object to enable the Social Scientists to disentangle the full stochastic complexity of socio-economic processes. SABRE development SABRE and GROWL GROWL provides a client-side lightweight library as a plug in to R, providing easy user friendly access to Grid resources and computational power, providing
You can watch a more detailed presentation about Growl by Dan Grose at the NCeSS conference on line at http://redress.lancs.ac.uk/Workshops/Presentations.html
Version on my PC • C:\2005-6 laptopfiloes\CQeSS\Oxford RMF\imp\dan_grose_large • Any Questions ?