Download

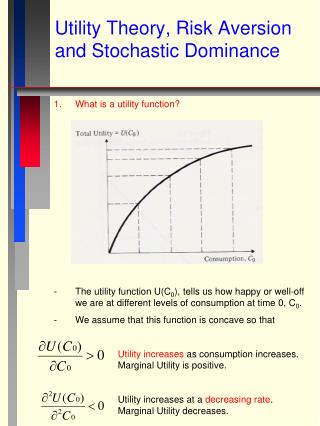
1 / 25
250 likes | 278 Views
Investigating violations of Stochastic Dominance, comparing TAX and RAM models, testing probability monotonicity, and exploring consequences predictions in 5 studies.

E N D
Testing Models of Stochastic Dominance Violations Michael H. Birnbaum Decision Research Center California State University, Fullerton
How to Explain violations of Stochastic Dominance? • Violations of SD refute a large class of theories including CPT. • Which model, TAX or RAM, makes more accurate predictions? • Series of 5 studies designed to investigate systematic manipulations.
Stochastic Dominance However, it is possible to find 70% violations of this property among undergraduates.
Violation of Stochastic Dominance 70% of undergrads choose B
Same Choice in Split Form 90% choose C over D
Studies of SD: Models and Heuristics • Do people violate SD by simply averaging the consequences and ignoring probabilities? • Is RAM or TAX more accurate in predicting when violations ARE or ARE NOT observed?
Models Require No New Parameters • RAM and TAX models are used with their parameters from previous data to make predictions to the new data. • One “new” parameter, logistic spread parameter, estimated from previous data used to predict choice percentages.
Logistic Choice Model Parameter, a, was chosen to fit the previous result that G- is chosen over G+ on 70% of choices.
Data Violate the Consequence Averaging Heuristic • Data from two studies with n = 330 show that participants respond to changes in probability. Rules out the consequence averaging heuristic. • RAM violates probability monotonicity when probability is transferred from highest to middle branch. Tested in next study (n = 428).
Probability Monotonicity • If probability is shifted from a branch leading to a lower-valued consequence to a branch leading to a better consequence, the utility of the gamble should be increased. • RAM/TAX satisfy PM in two-branch gambles, but not in three-branch gambles.
Study 3 (n = 428) • Choices constructed from the following: G+ = (96, .9; 14, .05; 12, .05) versus G- = (96, .85 - r; 12, .05 + r; 12, .05) Probability Monotonicity implies that the probability of choosing G- over G+ should decrease as r is increased.
Predictions • The RAM model implies violations of PM as probability is shifted from the highest branch to the middle branch. • TAX implies a very small effect, with a slight increase.
Results • The data show an increase, contrary to RAM as fit to previous data. • The increase is larger than predicted by TAX, which predicts virtually no effect of the manipulation.
Consequence Counting Heuristic • Perhaps people count how many branches of a gamble give higher consequences and choose the gamble with the greatest number of higher consequences. • We can alter the consequences so that G+ has two branches with higher consequences.
90 black win $97 05 yellow win $15 05 purple win $13 85 red to win $95 05 blue to win $91 10 white to win $11 SD Study 4: Consequences Predictions of TAX: 70% for ($97, $13) 68% for ($95, $11). Observed: 72% and 68% n = 315
90 red win $96 05 blue win $14 05 white win $12 85 red win $96 05 blue win $70 10 white win $12 SD Study 4: middle Branch Predictions of RAM and TAX Are 64% and 60%, respectively. Observed is 70%, n = 315.
Results: Study 4 • The effect of the middle branch was more closely predicted by TAX than RAM. • Reducing the other two branches by small amounts, to vary the number of branches favoring the dominant gamble had very small effects, approximated by TAX. This manipulation had less effect than predicted.
90 black win $97 05 yellow win $15 05 purple win $13 85 red win $90 05 blue win $80 10 white win $10 SD Study 5: All 3 conseqs. Predictions of TAX and RAM are 63% and 50%, respectively. Observed is 57%*, n = 394
Summary: 5 Studies of SD, 1467 participants • People respond to changes in probability, contrary to counting heuristic. • Both RAM and TAX can violate probability monotonicity, data closer to TAX than RAM. (*more) • People respond to changes in consequences, but not extremely.
To Save Heuristics • These data are not consistent with the consequence averaging heuristic, nor are they consistent with the contrast counting heuristic. • To save heuristics, we might argue that they work only in some people some of the time. • We can also change the heuristic to a different one in response to data.
Next Program: Demographic Correlates Does the rate of violation of SD relate to education, particularly training in decision-making? Next program will review web-based research that sought to recruit highly educated participants. Indeed, PhDs have lower rates of violation, but violations are still substantial, and would refute CPT.
For More Information: mbirnbaum@fullerton.edu http://psych.fullerton.edu/mbirnbaum/ Download recent papers from this site. Follow links to “brief vita” and then to “in press” for recent papers.