PAPI Deployment, Evaluation, and Extensions
PAPI Deployment, Evaluation, and Extensions. Shirley Moore , Daniel Terpstra, Kevin London, and Philip Mucci University of Tennessee-Knoxville Patricia J. Teller , Leonardo Salayandia, Alonso Bayona, and Manuel Nieto University of Texas-El Paso. Main Objectives.

PAPI Deployment, Evaluation, and Extensions
E N D
Presentation Transcript
PAPI Deployment, Evaluation, and Extensions Shirley Moore,Daniel Terpstra, Kevin London, and Philip Mucci University of Tennessee-Knoxville Patricia J. Teller, Leonardo Salayandia, Alonso Bayona, and Manuel Nieto University of Texas-El Paso . . UGC 2003, Bellevue, WA – June 9-13, 2003
Main Objectives • Provide DoD users with a set of portable tools and accompanying documentation that enables them to easily collect, analyze, and interpret hardware performance data that is highly relevant for analyzing and improving performance of applications on HPC platforms. UGC 2003, Bellevue, WA – June 9-13, 2003
PAPIPerformance Application Programmer Interface A cross-platform interface to hardware performance counters Tool Developer Advanced User Performance Monitoring Hardware Vendor Interface Application Programmer PAPI high-level Interface Low-level Interface • Thread-safe • Fully programmable • All native events and counting • modes. • Callbacks on counter overflow • SVR4-compatible profiling • Routines to start, read, and • stop counters • Specific list of event counts • Obtain performance data UGC 2003, Bellevue, WA – June 9-13, 2003
PAPI Standard Event Set • A common set of events that are considered most relevant for application performance analysis • Included in this set are: • Cycle and instruction counts • Functional unit status • Cache and memory access events • SMP cache coherence events • Many PAPI events are mapped directly to native platform events. • Some are derived from two or more native events. • Run avail to find out what standard events are available on a given platform. UGC 2003, Bellevue, WA – June 9-13, 2003
Deployment: Objectives • Develop a portable and efficient interface to the performance monitoring hardware on DoD platforms. • Install and support PAPI software and related tools on DoD HPC Center machines. • Collaborate with vendors and users to add additional features and extensions. UGC 2003, Bellevue, WA – June 9-13, 2003
Deployment: Methodology - 1 • Investigation of statistical sampling to reduce instrumentation overhead • PAPI substrate for HP AlphaServer based on DADD/DCPI sampling interface • 2-3% overhead vs. 30% using counting • Investigating similar approach on other platforms • Efficient counter allocation algorithm based on bipartite graph matching – improved allocation on IBM POWER platforms UGC 2003, Bellevue, WA – June 9-13, 2003
Deployment: Methodology-2 • Need easy-to-use end-user tools for collecting and analyzing PAPI data • TAU (Tuning and Analysis Utilities) from University of Oregon provides automatic instrumentation for profiling and tracing, with profiling based on time and/or PAPI data. • PAPI being incorporated into VAMPIR • perfometer graphical analysis tool provides real-time display and/or tracefile capture and replay. • papirun command-line utility under development (similar to perfex and ssrun on SGI IRIX) • dynaprof dynamic instrumentation tool under development UGC 2003, Bellevue, WA – June 9-13, 2003
TAU Performance System Architecture Paraver EPILOG UGC 2003, Bellevue, WA – June 9-13, 2003
Vampir v3.x: Hardware Counter Data • Counter Timeline Display UGC 2003, Bellevue, WA – June 9-13, 2003
Perfometer Parallel Interface UGC 2003, Bellevue, WA – June 9-13, 2003
Deployment: Methodology-3 • Memory utilization extensions allow users to obtain static and dynamic memory utilization information. • Routines added to low-level API: • PAPI_get_memory_info() • PAPI_get_dmem_info() UGC 2003, Bellevue, WA – June 9-13, 2003
Deployment: Results • PAPI implementations for the following DoD platforms: • Cray X1 implementation underway • PAPI installed at all four MSRCs and ARSC and MHPCC, plan to install at additional DCs • PAPI widely used by DoD application developers and HPCMO benchmarking team • Encouraging vendors to take over responsibility for implementing and supporting PAPI machine-dependent substrate • More information: http://icl.cs.utk.edu/papi/ IBM POWER3/4 HP AlphaServer SGI Origin Sun UltraSparc Cray T3E Linux clusters UGC 2003, Bellevue, WA – June 9-13, 2003
Evaluation: Objectives • Understand and explain counts obtained for various PAPI metrics • Determine reasons why counts may be different from what is expected • Calibrate counts, excluding PAPI overhead • Work with vendors and/or the PAPI team to fix errors • Provide DoD users with information that will allow them to effectively use collected performance data UGC 2003, Bellevue, WA – June 9-13, 2003
Evaluation: Methodology - 1 • Micro-benchmark: design and implement a micro-benchmark that facilitates event count prediction • Prediction: predict event counts using tools and/or mathematical models • Data collection-1: collect hardware-reported event counts using PAPI • Data collection-2: collect predicted event counts using a simulator (not always necessary or possible) UGC 2003, Bellevue, WA – June 9-13, 2003
Evaluation: Methodology - 2 • Comparison: compare predicted and hardware-reported event counts • Analysis: analyze results to identify and possibly quantify differences • Alternate approach: when analysis indicates that prediction is not possible, use an alternate means to either verify reported event count accuracy or demonstrate that the reported event count seems reasonable UGC 2003, Bellevue, WA – June 9-13, 2003
Example Findings - 1 • Some hardware-reported event counts mirror expected behavior, e.g., number of floating-point instructions on the MIPS R10K and R12K. • Other hardware-reported events can be calibrated, by subtracting that part of the event count associated with the interface (overhead or bias error), to mirror expected behavior , e.g., number of load instructions on the MIPS and POWER processors and instructions completed on the POWER3. • In some cases, compiler optimizations effect event counts, e.g.,the number of floating-point instructions on the IBM POWER platforms. UGC 2003, Bellevue, WA – June 9-13, 2003
Example Findings - 2 • Very-long instruction words can affect event counts, e.g., on the Itanium architecture the number of instruction cache misses and instructions retired are dilated by no-ops used to compose very long instruction words. • The definition of the event count may be non-standard and, thus, the associated performance data may be misleading, e.g., instruction cache hits on the POWER3. • The complexity of hardware features and lack of documentation can make it difficult to understand how to tune performance based on information gleaned from event counts—example: data prefetching, TLB walker. UGC 2003, Bellevue, WA – June 9-13, 2003
Example Findings - 3 • Although wehave not been able to determine the algorithms used for prefetching, the ingenuity of these mechanisms is striking. • In some cases, more instructions are completed than issued on the R10K. • The DTLB miss count on the POWER3 varies depending upon the method used to allocate memory (i.e., static, calloc or malloc). • Hardware SQRT on POWER3 not counted in total floating-point operations unless combined with another floating-point operation. UGC 2003, Bellevue, WA – June 9-13, 2003
Calibration Example - 1 • Instructions completed • PAPI overhead: 139 on POWER3-II UGC 2003, Bellevue, WA – June 9-13, 2003
Calibration Example - 2 • Instructions completed • PAPI overhead: 141 for small micro-benchmarks UGC 2003, Bellevue, WA – June 9-13, 2003
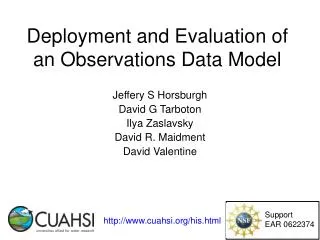
RIB/OKC for Evaluation Resources • Object-oriented data model to store benchmarks, results and analyses • Information organized for ease of use by colleagues external to PCAT • To be web-accessible to members • Objects linked between them as appropriate Benchmark General description of a benchmark Case Specific implementation and results Machine Description of platform Organization Contact information UGC 2003, Bellevue, WA – June 9-13, 2003
PCAT RIB/OKC Data Repository Example • Benchmark name: DTLB misses • Development date: 12/2002 • Benchmark type: Array • Abstract: Code traverses though an array of integers once at regular strides of PAGESIZE. The intention is to create compulsory misses on each array access. Input parameters are: Page size (bytes) and array size (bytes). The number of misses normally expected should be: Array Size / Page Size. • Files included:dtlbmiss.c, dtlbmiss.pl • About included files: dtlbmiss.c, benchmark source code in C, requires pagesize and arraysize parameters for input and outputs PAPI event count. • dtlbmiss.pl, perl script that executes the benchmark 100 times for increasing arraysize parameters and saves benchmark output to text file. Script should be customized for pagesize parameter and arraysize range. Links to files UGC 2003, Bellevue, WA – June 9-13, 2003
PCAT RIB/OKC Example Case Object Name: DTLB misses on Itanium Date: 12/2002 Compiler and options: gcc ver 2.96 20000731 (Red Hat Linux 7.1 2.96-101) –O0 PAPI Event: PAPI_TLB_DM, Data TLB misses Native Event: DTLB_MISSES Experimental methodology: Ran benchmark 100 times with perl script, averages and standard deviations reported Input parameters used: Page size = 16K, Array size = 16K – 160M (increments by multiples of 10) Platform used:HP01.cs.utk.edu (Itanium) Developed by:PCAT Benchmark used:DTLB misses Links to other objects UGC 2003, Bellevue, WA – June 9-13, 2003
PCAT RIB/OKC Example Case Object • Results summary: Reported counts closely match the predicted counts, showing differences close to 0% even in the cases with a small number of data references, which may be more susceptible to external perturbation. The counts indicate that prefetching is not performed at the DTLB level. • Included files and description: • dtlbmiss.itanium.c: Source code of benchmark, instrumented with PAPI to count PAPI_TLB_DM • dtlbmiss.itanium.pl: Perl script used to run the benchmark • dtlbmiss.itanium.txt: Raw data obtained, each column contains results for a particular array size, each case is run 100 times (i.e., 100 rows included) • dtlbmiss.itanium.xls: Includes raw data, averages of runs, standard deviations and graph of % difference between reported and predicted counts • dtlbmiss.itanium.pdf: Same as dtlbmiss.itanium.xls UGC 2003, Bellevue, WA – June 9-13, 2003
Contributions • Infrastructure that facilitates user access of hardware performance data that is highly relevant for analyzing and improving the performance of their applications on HPC platforms. • Information that allows users to effectively use the data with confidence. UGC 2003, Bellevue, WA – June 9-13, 2003
QUESTIONS? UGC 2003, Bellevue, WA – June 9-13, 2003