Download
1 / 74
740 likes | 905 Views
Of Viruses, Mosquitoes & Zombies How Mathematical Models can Help Control Epidemics. Adnan Khan Department of Mathematics Lahore University of Management Sciences. Of Viruses……. Literature Review Hethcote , H. The Mathematics of Infectious Diseases, SIAM Review 2000

E N D
Of Viruses, Mosquitoes & Zombies How Mathematical Models can Help Control Epidemics Adnan Khan Department of Mathematics Lahore University of Management Sciences
Of Viruses…….. • Literature Review • Hethcote, H. The Mathematics of Infectious Diseases, SIAM Review 2000 • Imran A, Malik T, Rqfique H & Khan, A. A model of bi-mode transmission dynamics of hepatitis C with optimal control, Theory in Biosciences 2013
…….Mosquitoes • Literature Review • Wearing, H. & Rohani P. Ecological and Immunological Determinants of Dengue Epidemics, PNAS 2006 • Khan, A. Hassan M. & Imran M. Estimating the Basic Reproduction Number for Single-Strain Dengue Fever Epidemics, Journal of Biological Dynamics 2014
and…….Zombies • Literature Review • P. Munz, I. Hudea, J. Imad and R.J. Smith? When zombies attack!: Mathematical modelling of an outbreak of zombie infection (Infectious Disease Modelling Research Progress 2009, in: J.M. Tchuenche and C. Chiyaka, eds, pp133-150). • White Zombie - 1932 • Revolt of the Zombies- 1936 • Zombie of Mora Tau – 1957 • El Muerto - 1961 • Night of the Living Dead - 1968 • Curse of the Living Dead - 1973 • Day of the Dead – 1985 • 28 Days Later – 2007
Zombie Attack!! https://code.google.com/p/simzombie/
Zombie Attack!! • There has been an outbreak of Zombies • How to model this? • How to suggest control measure? • What about their efficacy?
Influenza Data Timeline from Google googleflu.mov T. Malik, A. Gumel, L. Thompson, T. Strome, S. Mahmud; "Google Flu Trends" and Emergency Department Triage Data Predicted the 2009 Pandemic H1N1 Waves in Winnipeg, Manitoba. Canadian Journal of Public Health. 102(4):294-97.
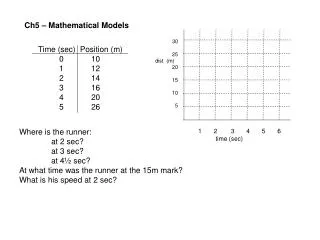
Influenza • An Army base has a total staff of 8342. An individual who has just returned from leave becomes ill and is diagnosed with Jade fever -- an exotic, dangerous and highly contagious variety of flu. • Will there be a flu epidemic on the base? • If so, does the base hospital have enough beds? • How many of the base staff will get the flu?
Dengue Fever Epidemic • A suitable model • Must include vector dynamics • Control Strategies • Retrospective analysis
Mathematical Epidemiology • What are epidemics? • Mathematical Models • Statistical • Finding ‘trends’ in available data • Mechanistic • Incorporating the mechanics of transmission • Retrospective Analysis • Data analysis
Dynamic / Mechanistic Models • Deterministic Models • Differential Equations • Difference Equations • Delay Differential Equations • Stochastic Models • Markov Chains • Stochastic Differential Equations
Why Dynamic Models • Models allow you to predict (estimate) when you don’t KNOW • What are the costs and benefits of different control strategies? • When should there be quarantines? • Who should receive vaccinations? • When should wildlife or domestic animals be killed? • Which human populations are most vulnerable? • How many people are likely to be infected? To get sick? To die?
A Basic SIR Model • Susceptible Population (S) • people who are able to catch the disease • Infectious Population (I) • people who have the disease and can transmit it • Removed Population (R) • people who have recovered and are no longer susceptible • People who are naturally immune or isolated etc.
The Model Assumptions • Susceptible individuals become infected upon coming in contact with infectious individuals. • Each infected individual has a fixed number, r, of contacts per day that are sufficient to spread the disease • The parameter r contains information about the number of contacts and probability of infection • Infected individuals recover from the disease at rate a • 1/a is the average recovery time
The Model Assumptions • The incubation period of the disease is short enough to be neglected • All population classes are well mixed • Births, deaths, immigration, and migration can be ignored on the timescale of interest
The Model Equations The rate of transmission of the disease is proportional to the rate of encounter of susceptible and infected individual.
Gaining Insight into the Model • Epidemiological Questions • Will an epidemic occur? • If an epidemic does occur • how severe will it be? • will the disease eventually die out or persist in the population? • how many people will get the disease during the course of the infection?
Gaining Insight into the Model • Definition: We will say that an epidemic occurs if the number of infectious individuals is greater than the initial number I0 for some time t • Epidemiological Question: Given r, S0 , I0, and a, when will an epidemic occur? • Mathematical Question: Is I(t) > I0 for any time, t?
When Will an Epidemic Occur? • Consider the I-equation first • Therefore, the I population will increase initially if and the I population will decrease initially otherwise. Therefore, this condition sufficient for an epidemic to occur. At t = 0
When Will an Epidemic Occur? • Now consider the S-equation • Therefore, if there will not be an epidemic. • However if, then an epidemic will occur. So if We know
Gaining Insight into the Model • Epidemiological Question: If an epidemic occurs, will the disease eventually die out or will it persist in the population. • Mathematical Question: What are the steady states and their stability. • More specifically, is I = 0 a steady state and if so is it stable?
Steady States • Note: I = 0 makes all three equations zero. • Therefore I = 0 represents an entire line (or plane) of steady states • Traditional stability analysis leads to a zero eigenvalue.
Phase Plane -- Analytically • Recall that R is decoupled
Gaining Insight into the Model Equations • Epidemiological Question: What will be the final state of the population be after the infection has run its course? • Mathematical Question: What are the steady states for S and R?
Steady States for S and R • S* = is the number of people who did not catch the disease.
Gaining Insight into the Model • How many people will catch the disease before it dies out?
Gaining Insight into the Model • Epidemiological Questions: When an epidemic occurs, how severe will it be? • Mathematical Question: What is the maximum number of infectious individuals?
Severity of Epidemic • I achieves its max when S = a/r
Basic Reproduction Number • As we’ve seen is an important parameter. • It is called the infectious contact number or basic reproduction number of the of the infection.
Basic Reproduction Number: Breakdown • A given infective will, on average, be infectious for 1/a units of time. • The number of susceptibles infected by one infectious individual per unit time is rS. • Therefore, the number of infections produced by one infective is rS/a. • If R0>1, then an epidemic will occur
Importance of R0 • R0 is not actually a characteristic of the disease) but of the virus in a specific population at a specific time and place. By altering some or all of the components you can also alter R0.
Fit of the Model to Data for Influenza In 1978, a flu epidemic occurred in a boys boarding school in the north of England. There were 763 resident boys, including one initial infective. The school kept records of the number of residents confined to bed, and we will assume those to be the infectives. The data for the two-week can be fit to the SIR model.
Results of the SIR Model • The occurrence of an epidemic depends solely on the number susceptibles, the transmission rate, and recovery rate. • The initial number of infectives plays no role in whether or not there is an epidemic. • That is, no matter how many infectives there are, an epidemic will not occur unless S0 > a/r.
Modifications of the SIR Model • Other considerations, such as vital dynamics (births and deaths), length of immunity, the incubation period of the disease, and disease induced mortality can all have large influences on the course of an outbreak.
Another Example • An Army base has a total staff of 8342. An individual who has just returned from leave becomes ill and is diagnosed with Jade fever -- an exotic, dangerous and highly contagious variety of flu. • All individuals getting this flu must be hospitalized. The base hospital has 240 beds. The transmission parameter for this flu at this base is r = 5x10⁻⁵ per day and the recovery rate is a = .32 per day.
Questions For You • Is the condition for an epidemic satisfied? • Does the base hospital have enough beds? • How many of the base staff will get the flu?
Answers • Is the condition for an epidemic satisfied? • S0 =8341, I0 = 1, R0 = 0 • Therefore an epidemic will occur.
Answers • Does the hospital have enough beds? • Therefore if the hospital has 245 beds, it will need more.
Answers • How many of the base staff will get the flu? • S* = 4783, so about 3649 people (43% of the population) will catch the disease.
S.I.R.S Model • The model equations are • This allows for endemic steady states