Download
1 / 13
130 likes | 261 Views
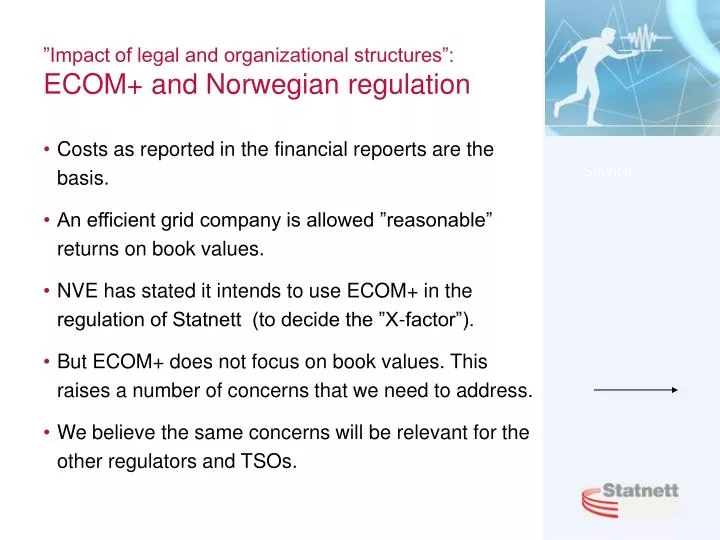
”Impact of legal and organizational structures”: ECOM+ and Norwegian regulation. Costs as reported in the financial repoerts are the basis. An efficient grid company is allowed ”reasonable” returns on book values.

E N D
”Impact of legal and organizational structures”: ECOM+ and Norwegian regulation • Costs as reported in the financial repoerts are the basis. • An efficient grid company is allowed ”reasonable” returns on book values. • NVE has stated it intends to use ECOM+ in the regulation of Statnett (to decide the ”X-factor”). • But ECOM+ does not focus on book values. This raises a number of concerns that we need to address. • We believe the same concerns will be relevant for the other regulators and TSOs.
The ”foregiveness factor” • Alters weights given to data in particular years • Could also be used to adopt to regulatory base • but it is not the only option • the name itself could be misleading • But in ECOM, the published report focused on results without foregiveness factor. • Need to take a closer look on the significance....
The captial costs • Capital cost distribution over time for a 100 MNOK investment over 30 years ECOM+ straight line depreciation + returns (regulated asset base) (Case: Real rate of return: 6%. the inflation has been 5,7% on average the latest 30 years) The graph shows nominal values. That does not affect the relationship between the two lines much.
The impact (1) • Old investments completely dominates the resulting unit cost of ECOM+, contrary the basis for regulation old investments will contribute more to both sides of the fraction line, and thereby to the result.
The impact (2) • Captial completely dominates over operational costs
Amplifiers • Technological breakthroughs has led to lower (real) costs compared to the 1970-1980’s. • This amplifies the domination of old investments in the total unit cost fraction, as new investments (in absolute terms) counts less.
Possible consequenses (1) • The analysis turns static. • Looking 5 years forward, a company would gain no more than 2% improvement in its efficiency score even if it reduces all investment unit costs by 20% relative to other TSOs every year. After 10 years measured efficiency would increase by 5% (*). • The only thing that will move results, are changes in methodology, new entrants, and changes in data given by the companies. 2% efficiency gain is clearly within error margins of the study. • Two companies A and B, have the same asset base in 2003 (100 MNOK) and the same history. The profile of historical investments corresponds to that of Statnett, which is quite typical norwegian profile for a grid company. • From 2004, Company A each year reinvests an amount equal to 100% of book depreciation last year, thus maintaining book value of the company. • Company B is more efficient, invests same equipment, but at 80% of the price. Little point in repeating the Ecom+ study if it is static (*):
Possible consequenses (1b) • ”But we’re in a long term capital intensive industry” • surely, it should take some time to change the overall capital efficiency • but that does not provide sufficient argument for any degree of static emphasis • If adjusted to the regulatory capital base (book deprciation and capital base), the 2% measured efficiency gain over 5 years from reducing yearly investment costs by 20% would increase to 5% in the previous example. Capital is still a stable, long term measured element. But the impact of efficiency gains would then be consistent with the book value base which is used for tariffication and regulatory purposes.
Possible consequenses (2) • Regulatory incentives • Efficiency analysis is becoming an increasingly important incentive cornerstone in Norwegian regulation. • The timelag incentive scheme can only work in a consolidation phase. • Better efficiency analysis may be the only way to support regulatory incentives for efficient conduct in times of growth.
Possible consequenses (2) • The TSO should focus on improvements on matters that it can influence. From an Ecom+ perspective, that includes • operational efficiency • Benchmarked opex account for less than 10% of the final ECOM+ result, but more than twice as much in our accounts and regulatory tariff. • upcoming reinvestments and investments • The efficiency analysis does not give much feedback on these efforts. • Llittle relationship between measured efficiency and future actions of the network company,
Possible consequenses (3) • Regulatory inconsistency • Regulation will, in the end, be used to set maximum tariffs • Old investments are present in tariffs only to a small degree. • Level of tariff could thus be 100% efficient, yet the grid company could experience serious claims of inefficiency ”from the past” and have to reduce tariffs even more. There could be legal problems. • The ”old net problem”: Old grid companies have a problem already, due to low captial base for upcoming reinvestment phase.
Enter the ”forgiveness factor”? • Use one weighted avarage regulated depreciation period, and construct a common forgivness factor for each year that gives the same impact from new and older data as the book depreciation method? • Alternatives: • Or should we adjust the formula so that we measure efficiency year by year (visualizing yearly improvements), and weigh the results at the end. The efficiency curve over time is truly interesting, and gives valuable information on data quality and sources of inefficiency. • Dynamic calculations of catch-up effects etc? Interesting, but does not give the relevant efficiency score relevant for setting the X-factor!
Conclusion • Statnetts view is that the main final report should be as relevant a document as possible. • The dynamic issues are essencial to • keep the process alive • develop better efficiency analysis over time • develop better regulation • ”Hiding” the only relevant analysis in private taylor made ”foregiveness factor” sensitivities is not considered a good alternative.