Comprehensive Software for Predicting Trout Growth in Raceway Systems
This project aims to develop a comprehensive software tool that enhances the management of trout raceways by allowing growers to predict and optimize fish growth conditions. Users can enter data related to raceway design, food, and fish stocking, which the software uses to simulate environmental conditions, forecast growth rates, oxygen levels, and economic parameters over time. This tool not only helps growers manage daily operations more efficiently but also aids investors in estimating the productivity and economic potential of raceways, ultimately improving fish farming profitability.

Comprehensive Software for Predicting Trout Growth in Raceway Systems
E N D
Presentation Transcript
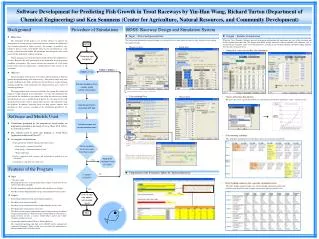
The titles of scenarios that have been simulated in RDSS will be displayed in the drop-down menu, and the corresponding economic information obtained in RDSS will be loaded automatically. Software Development for Predicting Fish Growth in Trout Raceways by Yin-Han Wang, Richard Turton (Department of Chemical Engineering) and Ken Semmens (Center for Agriculture, Natural Resources, and Community Development) Background Procedure of Simulations RDSS: Raceway Design and Simulation System • Input – Enter background data • Output – Results of simulation • Motivation • The motivation of this project is to develop software to improve the management of existing raceways and to help investors estimate the productivity and economic potential of future raceways. For example, it would be very helpful to growers if they could predict when oxygen concentration in a tank reaches a critical level for healthy fish production and subsequently take action to prevent this undesirable condition occurring. • Various programs have been developed to help calculate the conditions in a raceway. However, they only provide part of the information about the growing conditions in hatcheries. The current software tool integrates all of the major factors about a raceway and provides a complete picture of the raceway at any given time. • Objective • The basic purpose of this project is to build a software program to help fish growers design and manage their own raceways. This software helps keep track of daily conditions in the tanks, and forecasts the growth rates, oxygen demand, ammonia production, food requirements for optimal growth, and a variety of economic parameters. • The required input from a user/grower includes the starting date, initial fish length or weight, predicted water temperatures, etc. Once this information has been entered, the simulation is run, and the state of the fish and raceways during the following two years is predicted and displayed. It is the intent of this work that fish growers will be able to manage their raceways more efficiently using this program. In addition, extension agents can help growers improve their operation for their raceways according to the information provided by the program. The background information required to input is classified to five sections which are raceway data, food data, fish-stocking plan and water data. When the “Save/ Simulate” button is pressed, the program will perform the simulations and save all the data input and results obtained from this form. The outputs from RDSS include numerical values of monthly fish conditions such as fish growth and cash flow, charts of various parameters, calendar of fish-stocking schedule, and daily feeding summary for a specific customized week. ENTER • Raceway data • Food data • Numerical values of monthly fish conditions Read data input and options Rest the mouse on a food button, the detailed information about this option will be displayed When the Apply button is pressed, these data will be applied to raceways 1_1 and 2_1. TODAY = TODAY + 1 TODAY=1/1/06 Simulate conditions of fish ( weight, length ,number, total weight ) Customer-defined influent oxygen concentration • Fish-stocking Plan • Water Data • Charts of Various Parameters The charts give users a quick idea of how a raceway behaves/will behave and when a “risky” situation occurs. Calculate parameters associated with food Software and Models Used Calculate oxygen and ammonia concentration • Calculations performed by this program are based mainly on information provided in the book: Flowing Water Fish Culture by Soderburg (1994). • The software used to create this program is Visual Basic Application in Microsoft ExcelTM. • Assumptions in Simulations • Daily growth rate of fish is influenced by three factors: • Feed quantity – amount of food fed • Feed quality – nutritional content of food • Water temperature • Food is supplied to fish everyday and instantaneous growth rates are calculated. • Simulation is carried out on a daily basis. • Fish-stocking schedule This worksheet reminds growers when they need to move (or have moved) fish. Do the conditions on this day reach the critical values? As users switch to a different scenario, all of the input data for that scenario will be automatically loaded. While entering a stocking/ harvest movement, the calendar will be instantaneously updated to help users have an overview about the whole schedule. Record the simulated results of TODAY YES Is TODAY =12/31/07? Features of the Program • Cooperation with Economic Tables by Tatiana Borisova NO • Input • “One-time” input The program will save all of the inputs and scenarios so that users do not need to enter them repeatedly. • Provide immediately-updated calendar for fish stock/harvest schedule • Provide customer-defined influent oxygen concentration for each raceway • Output • Forecasting conditions of fish and economic parameters • Providing a fish-stocking schedule • Providing a user-customized weekly feeding summary for any week • Providing charts of parameters versus time The charts for fish length, food amount required, and percentage of effluent oxygen concentration to saturated oxygen concentration give the grower a quick overview of how a raceway is/will behave and if any “risky” situations are likely to occur. • Cooperation with Economic Tables by Tatiana Borisova The simulated fingerlings and food cost by RDSS will be automatically exported to Economic Tables so that users can utilize this information to obtain a further analysis for their farms. • Daily feeding summary for a specific customized week The daily feeding summary helps users obtain detailed information about what and how much food they need to supply and purchase during a specific week. YES Save all input data, options, and recorded results EXIT