Download

1 / 68
680 likes | 825 Views
Maximum Economically Achievable Electricity Savings from Unconstrained Investment in Energy Efficiency 2012 - 2031. Presented to the Vermont Public Service Board February 18, 2011. Contents. Overview Approach Results Revisions to Analysis Presented on December 20, 2010

E N D
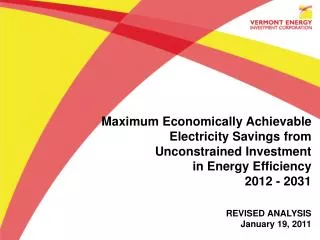
Maximum Economically Achievable Electricity Savings from Unconstrained Investment in Energy Efficiency 2012 - 2031 Presented to the Vermont Public Service Board February 18, 2011
Contents • Overview • Approach • Results • Revisions to Analysis Presented on December 20, 2010 • Major Drivers of Long-Term Changes in Opportunities • Issues 2
Overview 3
DRP Context • VELCO unconstrained savings forecast constitutes a “boundary case” in the Public Service Board’s DRP process • It is the first of four efficiency resource plans to be developed, analyzed, and compared with the maximum achievable analysis 4
Additional Scenarios • Flat budget to acquire all economically achievable potential across 20 years • Ramp up across 5 years to achieve 3% savings, relative to annual energy use • Status quo budgets adjusted for inflation 5
History • PSB DRP process created after VELCO engaged VEIC to conduct the analysis for unconstrained potential • Necessitated expansion of scope of work to include updating costs and savings estimates over time for key efficiency technologies, applicable across DRP scenario—especially lighting 6
Approach 7
Maximum Economically Achievable Efficiency Savings Operating definition: The maximum amount of cost-effective electricity savings that can be achieved, as quickly as possible, by deploying the most aggressive program strategies available in all major residential and business markets. 8
Guiding Principles IF avoided costs are constant or rising in real terms, all else being equal, AND the sooner and faster maximumachievable savings are achieved, THEN the greater the resulting net benefits.* Maximum achievable penetration rates are the result of informed professional judgment about what’s possible with the most aggressive intervention strategies in each market. *This is automatically true, due to discounting 9
General Approach • Same basic approach as analysis used • in 2009 Forecast 20: • Integration with VELCO 2010 Forecast • Updated efficiency technology characterizations • Two-stage analysis of measures / measure bundles • Conceptual program design • Market penetration rates 10
Integration with VELCO 2010 Forecast • Preliminary 2010 sales and peak demand forecast (Itron) • VEIC worked closely with Itron to coordinate energy sales baseline energy intensities with savings analysis baselines • This time Itron prepared a forecast adjusted for effects of continued EEU investments of $40 million annually throughout the period • Along with an unadjusted forecast, without the effects of any continuation of Vermont DSM investment in efficiency 11
Development of 90 / 10 Scenario • Indicates expected summer peak demand savings under extreme weather conditions • Assumes that the 90 / 10 DSM savings have the same percentage increase over the 50 / 50 DSM savings as the 90 / 10 forecast has over the 50 / 50 forecast 12
Updated Characterizations of Efficiency Technology • Re-assessed future changes in baseline • Characterized additional measures • (including solar residential hot water) 13
Two-stage Analysis of Measures / Measure Bundles • Assess the cost-effectiveness of efficiency measures or measure bundles • Predict maximum penetration rates with most aggressive conceptual program designs specified for each market • Same approach as with original Forecast 20 and • to be conducted in the analysis of • other efficiency resource plans in the DRP process. 14
Avoided Costs Used in this Analysis From 2009 Regional Analysis of Avoided Costs (Synapse Energy Economics) Expressed at same level as VELCO forecast 15
Conceptual Program Design • Program design incorporates incentives covering 100% of installed or incremental costs, depending on market. • Exceptions where experience suggests customers will adopt measures with less than 100% cost reimbursement Example: Incentives for large C&I customer retrofits Program will “buy down” customer investment costs to 1 year, enabling customers to fund their contribution to efficiency investments out of operating budgets. 16
Market Penetration Rates Retrofit Markets Annual pace and acceleration in market penetration is discretionary and constrained only by infrastructure readiness. Lost Opportunity Markets • Replacements: Pace depends on natural turnover of existing equipment stock • New Construction: Pace depends on number of homes and business facilities 17
Residential Existing Homes Retrofit • Piggyback on fossil heating retrofit program designed to retrofit the entire Vermont housing stock across 20 years • Direct installation of all cost-effective electric efficiency measures • Whole-house re-lighting • Early replacement of appliances, AC • Electric water heating conversion to solar or natural gas Products • Target all existing homes not reached through the retrofit programs • Lighting 18
Commercial & Industrial Existing Facilities Retrofit • Plan on achieving 80 – 90% participation among targeted eligible customers in as short a time as possible • Ramp up from current levels within 3 years to a maximum sustainable rate to reach that target, backing down gradually throughout the rest of the 20-year horizon Lost Opportunity • Terminal market penetration rates approach 80 – 90% for all but infra-marginal (not most efficient) alternatives • The EEU could ramp up to these maximum rates in 3 – 5 years 19
Improvements in Residential Efficiency Analysis(over 2009 Forecast 20) • Lighting • In F20, program savings for standard spiral CFLs ended in 2014 (after first phase of EISA regulations). Based on recent evaluations and negotiations with DPS, CFL (standard and specialty) assumed to continue (with the EISA compliant baseline shift) until 2019. • SSL lighting re-characterized • Recessed down light added • Appliances • New CEE tiers added / adjusted 20
Improvements in Residential Efficiency Analysis(over 2009 Forecast 20) • Other additions • Air sealing and insulation measures for electric heat • Cooling savings from shell measures • Solar hot water as an efficiency measure • Separated low-income from existing homes • Matched RNC lighting and product assumptions to products program 21
Improvements in C&I Efficiency Analysis(over 2009 Forecast 20) • Lighting • New measures characterized for SSL for: down-lighting, screw-in, linear fluorescent replacement, refrigerated case light fixtures • Revised assumptions for LED costs and efficacy changes over time, based on revised Multi-Year Program Plan for SSL R&D (DOE EERE, March 2010) • New measures characterized for reduced-wattage T8 lamp and lamp / ballast Example Existing T12 lighting is replaced due to EISA phase-out of T12 lamps, and lower-wattage / lumen replacements are suitable, rather than straight T8 lamp / ballast replacements. 22
Improvements in C&I Efficiency Analysis(over 2009 Forecast 20) • HVAC measure characterizations updated, future adjustments made for changing federal standards • Due to advances in efficient technologies, new retrofit opportunities assumed to become available for more recently installed equipment,10 to 15 years out • Assumed that measure costs would increase gradually over time (in real dollars), based on an expectation of a gradual increase in the cost of savings due to increasing baselines. 23
Additional Savings— Other Sources not Considered Other sources of cost-effective efficiency savings that were not considered in this analysis—or in Itron’s forecast—that would increase maximum achievable efficiency savings: • Accelerating the adoption of more efficient standards for buildings and equipment • New, undiscovered, unidentified technologies emerging beyond 2020 • Changes in the load profiles of equipment and appliances with the introduction of real-time pricing and usage displays 24
The Big Picture: 2012 - 2031 2,317 GWh / year 390 MW / year Summer Peak 390 MW / year Winter Peak
Societal Net Benefits & Benefit-Cost Ratios * Because societal costs are negative, BCR is meaningless
Electric System Net Benefits & Benefit-Cost Ratios * Because societal costs are negative, BCR is meaningless