Download
1 / 27
270 likes | 304 Views
Learn about absolute, relative, and attributable risks, odds ratio, and how to interpret risk ratios in epidemiological studies to assess the association between exposure and disease. Understand measures of risk factors and their impact.

E N D
Measurements of Risk & Association … A.Prof. Dr. Maha A. AL-Nuaimi Ph.D. Com.Med.
Learning objectives • Understand measures of absolute, relative and attributable risks, AR%, Odds Ratio • Estimate absolute, relative and attributable risks, AR%, Odds Ratio, from epidemiological studies. • Interpret Relative risk (RR) & Odds ratio (OR), AR% as a measure of association between exposure and Disease
Definitions Risk • Probability of an individual developing a disease or change in health status over a fixed time interval. ( Absolute risk) - How can you measure the risk? - How do you know that this risk is high or low?
A risk factor • Is any attribute, characteristic or exposure of an individual that increases the likelihood of developing a disease or injury.
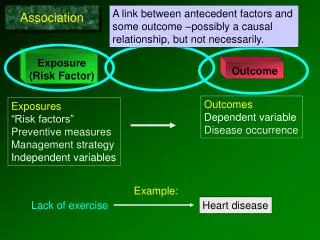
AssociationA statistical relationship between two or more variables.
How we can estimate the magnitude of the association between exposure & health-related events ?? • By Epidemiological Studies (analytic) As : It indicates the likelihood of developing the disease in the exposed group relative to the non-exposed; • Cohort study. • Case –Control study
In Cohort Study or prospective studies where the risk is estimated directly by: • Relative Risk (RR), • Attributable Risk, • Attributable Risk %, • In case-control studies – where the risk is estimated indirectly by • Odds Ratio (as the incidence is not known)
Relative Risk (Risk Ratio) • Estimates the magnitude of an association between exposure & disease. • It is important in the causation & in the policy of prevention. Risk Ratio (RR) = incidence among exposed group incidence among non exposed
Start Outcome Family smoker 500 children Exposed Diseased 300 Children (<12 yrs) 1000 Not diseased 200 1 year Diseased 120 Family non-smoker 500 children Not exposed Not diseased 380
Rate: Incidence rate • Incidence of Resp. Infection among exposedchildren: 300 500 * 100 = 60% • Incidence of Resp. Infect. Among non exposedchildren: 120 500 *100 = 24%
Cohort Study(cont.) Relative RiskIncidence rate among exposed Risk Ratio = Incidence rate in non exposed. 60% 24% = 2.5 ? RR = 1: means zero (no effect of the exposure) RR > 1: means (positive effect of the exposure) RR < 1: means negative effect of exposure (protective) Interpretation of RR Children of family Smokers were 2.5 times as likely to develop chest infections as were children of family non-smokers.
Attributable risk (AR), Risk difference) Excess Risk, (Incidence Difference: • Excess risk of the disease in those exposed • compared with those none exposed. • AR = Inc.exp – Inc. non-exp
Base-line risk Incidence A R I. among non exposed I. among exposed
Attributable Risk: 60% - 24% = 36% • interpretation 36% of Resp. Infection among <12 children can be attributed to family smoking.
Attributable Risk % (AR%): (population attributable risk) • The proportion prevented in Pop. • The percentage of cases which could be prevented if we remove the exposure to that factor. • AR% = Ie – Io * 100 Ie AR% = 36% / 60% = 60% interpretation?
AR% (population attributable risk) • The value of AR% in any pop. depends on ? • Example: • AR% = 92% (for lung cancer with smoking) • AR% = 38% (for lung CHD with smoking) • Upon which the cessation of smoking will have a greater impact??
Rate Ratio A rate ratio compares two groups in terms of , person-time rates, or mortality rates. Rate ratio = rate for group of primary interest rate for comparison group The interpretation of the value of a rate ratio is similar to that of the risk ratio.
Doll and Hill study : Mortality of British doctors cited from Mausner, 1985
OR (Odds Ratio, Relative Odds) • It is a measure of choice for case-control study. • In (CCS), we cannot calculate the IR → NO RR. • OR used to measure the association between • exposure & disease in (CCs), instead of RR (cohort).
Case Control Studies CROSS -RATIO
OR:- Odds refer to single entity“- Odds of factor among cases divided by odds of factor among control”OR =
Odds ratio a = No. of persons with disease and with exposure of interest b = No. of persons without disease, but with exposure of interest c = No. of persons with disease, but without exposure of interest d = No. of persons without disease & without exposure of interest a + c = total number of persons with disease (“cases”) b + d = total number of persons without disease (“controls”)
Example: A study of TB with bad nutrition in a case-control study. RiskFactor • OR= 100x140 / 40x80 = 4.4 • interpretation • TB patients have 4 times history of bad nutrition than healthy.
In interpreting the risk estimates, say for: • RR there is a (…) folds/times risk to develop the outcome "?" on being exposed to (!). • For AR (& AR% too); the excess risk to develop the outcome "?" form the exposure to (!) is (…). • For OR, those with the outcome "?" are (…) times more likely to be exposed to (!).
Which of the above measures quantifies the strength of the association?
Measuring of Risk in epidemiology, does it determine the cause of a disease in a given individual ??