Download
1 / 11
110 likes | 123 Views
Case Study: Risk – Risk Comparison n-Propyl Bromide vs. Perchloroethylene in Dry Cleaning. Harvey Clewell The Hamner Institutes for Health Sciences Research Triangle Park, NC. Risk Comparison: Perchloroethylene (Perc) vs. n-Propyl Bromide (nPB).

E N D
Case Study: Risk – Risk Comparisonn-Propyl Bromide vs. Perchloroethylene in Dry Cleaning Harvey Clewell The Hamner Institutes for Health Sciences Research Triangle Park, NC
Risk Comparison: Perchloroethylene (Perc) vs. n-Propyl Bromide (nPB) Issue: EPA regulation of Perc use in dry cleaning is leading to substitution of Perc with nPB * CalEPA Prop 65 listing * * Not yet regulated by EPA ** * EPA regulatory limit
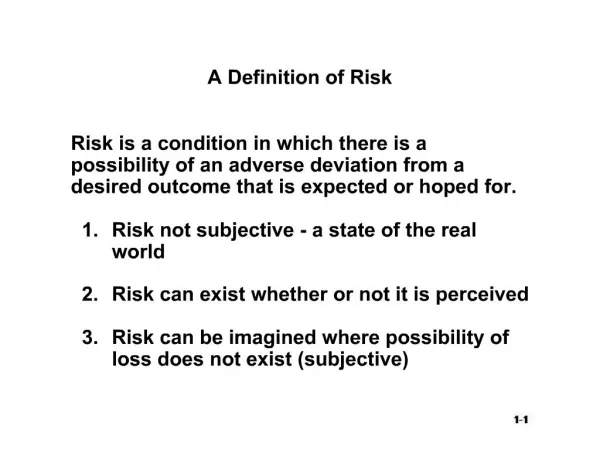
Case Study on Risk – Risk Comparison • Goal: Develop a methodology for comparing risks of alternative materials • Assure hazardous materials are not replaced with more toxic alternatives • Challenge: current risk assessment paradigms are ill-suited for such situations • conservative assumptions/analyses • Ad hoc uncertainty factors • Approach: review original data on each chemical, and conduct parallel analyses comparing best estimates rather than biased (health-protective) estimates
Differences Between Conservative Risk Assessments and Risk – Risk Comparisons
Elements of Risk – Risk Comparison • Characterization of best estimate and range of estimates • Consistent with OMB Principles for Risk Assessment • Unbiased characterization of uncertainty • Probability distributions of predicted risks • CSAFs in place of UFs • Semi-quantitative documentation of expert judgment • Decision (probability) trees (Clewell et al. 2008) • Rodricks plots (Rodricks et al. 1987)
Decision Analysis Framework for Methylene Chloride Species Pharmacokinetics Dose Response Model Applied PB-PK MLE LMS Other Species Internal Dose Risk per Dose Animal Bioassay Unit Risk Human Pharmacokinetics Species to Human Pharmacodynamics Body Surface Body Weight Applied PB-PK Human Internal Dose Human Exposure Target Dose Source: Clement and Tatman, 1990
Unit Risk Human Pharmaco- kinetics Pathway MFO 0.2 GST 0.7 DCM 0.1 Species to Human Pharmacodynamics 5.64e-5 1.45e-6 1.45e-6 3.48e-6 4.46e-6 1.15e-7 1.15e-7 2.75e-7 1.06e-5 5.55e-7 6.38e-6 n/a 8.4e-7 4.38e-8 5.04e-7 n/a PB-PK 0.7 Body Surface 0.3 Species Pharmacokinetics Applied 0.3 MFO 0.2 GST 0.7 DCM 0.1 Applied 0.2 PB-PK 0.7 Body Weight 0.7 Applied 0.3 MFO 0.2 GST 0.7 DCM 0.1 Weighted average of unit risk = 2.1x10-7 PB-PK 1.0 Body Surface 0.2 Applied 0.0 MFO 0.2 GST 0.7 DCM 0.1 PB-PK 0.8 PB-PK 1.0 Body Weight 0.8 Applied 0.0 Methylene Chloride Tree Diagram OLD EPA FDA NEW EPA USAF Source: Clement and Tatman, 1990
Unit Risk Distribution for DCM Unit Risk (x10-7) Source: Clement and Tatman, 1990
Relative Impact of Decisions on Risk Source: Clement and Tatman, 1990
Relative Impact of Mode of Action Decision vs. Model Uncertainty on Risk Lung GST Liver GST Liver MFO Lung MFO Source: Clement and Tatman, 1990
Example of Rodricks Plot Source: Gentry et al. 2011