
Graphing Polynomial Functions to Find Intercepts and Turning Points
Learn how to plot the x-intercepts, determine the end behavior, and identify local maximums and minimums of polynomial functions using specific examples. Also, discover how to maximize the volume of a rectangular box using a polynomial model.

Graphing Polynomial Functions to Find Intercepts and Turning Points
E N D
Presentation Transcript
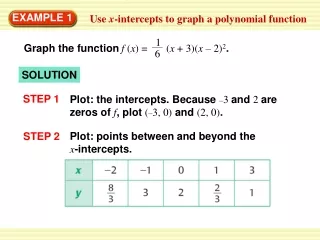
1 Graph the functionf (x)= (x + 3)(x – 2)2. 6 EXAMPLE 1 Use x-intercepts to graph a polynomial function SOLUTION STEP 1 Plot: the intercepts. Because –3 and 2 are zeros of f, plot (–3, 0) and (2, 0). STEP 2 Plot: points between and beyond the x-intercepts.
Determine: end behavior. Because fhas three factors of the form x –kand a constant factor of , it is a cubic function with a positive leading coefficient. So, f (x) → –∞ as x → –∞ andf (x) → + ∞ asx → + ∞. 1 6 EXAMPLE 1 Use x-intercepts to graph a polynomial function STEP 3 STEP 4 Draw the graph so that it passes through the plotted points and has the appropriate end behavior.
Graph the function. Identify the x-intercepts and the points where the local maximums and local minimums occur. a. f (x) = x3 – 3x2 + 6 b. g (x) 5 x4– 6x3 + 3x2 + 10x – 3 EXAMPLE 2 Find turning points
ANSWER The x-intercept of the graph is x –1.20. The function has a local maximum at (0, 6) and a local minimum at (2, 2). EXAMPLE 2 Find turning points SOLUTION a. f (x) = x3– 3x2 + 6 a. Use a graphing calculator to graph the function. Notice that the graph of fhas one x-intercept and two turning points. You can use the graphing calculator’s zero, maximum, and minimum features to approximate the coordinates of the points.
ANSWER The x-intercepts of the graph are x –1.14, x 0.29, x 1.82, and x 5.03. The function has a local maximum at (1.11, 5.11) and local minimums at (–0.57, –6.51) and (3.96, –43.04). You can use the graphing calculator’s zero, maximum, and minimum features to approximate the coordinates of the points. EXAMPLE 2 Find turning points SOLUTION b. g (x) 5 x4– 6x3 + 3x2 + 10x – 3 a. Use a graphing calculator to graph the function. Notice that the graph of ghas four x-intercepts and three turning points.
Arts And Crafts You are making a rectangular box out of a 16-inch-by-20-inch piece of cardboard. The box will be formed by making the cuts shown in the diagram and folding up the sides. You want the box to have the greatest volume possible. EXAMPLE 3 Maximize a polynomial model •How long should you make the cuts? • What is the maximum volume? • What will the dimensions of the finished box be?
EXAMPLE 3 Maximize a polynomial model SOLUTION Write a verbal model for the volume. Then write a function.
EXAMPLE 3 Maximize a polynomial model = (320 – 72x + 4x2)x Multiply binomials. = 4x3– 72x2 + 320x Write in standard form. To find the maximum volume, graph the volume function on a graphing calculator. Consider only the interval 0< x < 8 because this describes the physical restrictions on the size of the flaps.
From the graph, you can see that the maximum volume is about 420 and occurs when x 2.94. ANSWER You should make the cuts about 3inches long.The maximum volume is about 420cubic inches. The dimensions of the box with this volume will be about x = 3inches by x = 10inches by x = 14 inches. EXAMPLE 3 Maximize a polynomial model
ANSWER x-intercepts: –2, 1, 3 local minimum: (2.1, –1.0) local maximum: (–0.79, 2.1) for Examples 1, 2 and 3 GUIDED PRACTICE Graph the function. Identify the x-intercepts and the points where the local maximums and local minimums occur. 1. f(x) = 0.25(x + 2)(x – 1)(x – 3)
ANSWER x-intercepts: 1, 4local minimum: (3, –8)local maximum: (–1, 0) for Examples 1, 2 and 3 GUIDED PRACTICE Graph the function. Identify the x-intercepts and the points where the local maximums and local minimums occur. 2. g (x) =2(x – 1)2(x – 4)
ANSWER x-intercept: –3.1local minimum: (0.39, 1.8)local maximum: (–1.7, 4.1) for Examples 1, 2 and 3 GUIDED PRACTICE Graph the function. Identify the x-intercepts and the points where the local maximums and local minimums occur. 3. h (x) = 0.5x3 + x2 – x + 2
ANSWER x-intercepts: –3.1, 1.4local minimums: (–2.3, –9.6),(0.68, –7.0)local maximum: (–0.65, –3.5) for Examples 1, 2 and 3 GUIDED PRACTICE Graph the function. Identify the x-intercepts and the points where the local maximums and local minimums occur. 4. f (x) = x4 + 3x3 – x2 – 4x – 5
(15 2x) (10 2x) ANSWER The cuts should be about 2inches long. The maximum volume is about 132cubic inches. The dimensions of the box would be 6inches by 11inches by 2inches. for Examples 1, 2 and 3 GUIDED PRACTICE 5. WHAT IF? In Example 3, how do the answers change if the piece of cardboard is 10inches by 15inches? = (150 – 50x + 4x2)x Multiply binomials. = 4x3– 50x2 + 150x Write in standard form.


