Download
1 / 5
50 likes | 63 Views
Explore the total annual real returns on shares in the USA and Sweden from 1871 to 1999, comparing the S&P 500 and Swedish indices. Gain insights into price-earnings ratios, averages, trends, and expected returns based on historical data sources.

E N D
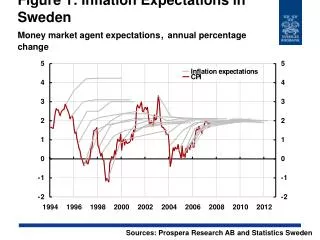
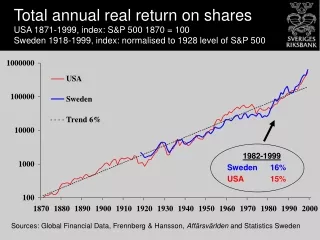
Total annual real return on shares USA 1871-1999, index: S&P 500 1870 = 100Sweden 1918-1999, index: normalised to 1928 level of S&P 500 1982-1999 Sweden 16% USA 15% Sources: Global Financial Data, Frennberg & Hansson, Affärsvärlden and Statistics Sweden
Price-earnings ratio for Sweden and USAAffärsvärlden general index and S&P 500 S&P 500 average for 1871-1999 Note: Exceptionally high P/E ratios for Sweden in 1992 and 1993 are not shown here Sources: Global Financial Data and Statistics Sweden
Real trends in US sharesS&P 500, average annual percentage change Note. Averages calculated as geometric mean. Somewhat different results may be obtained with an arithmetic mean, an estimated time trend or another base year, but the results still support the conclusion that the earnings trend in recent years is not markedly higher than for the entire post- World War Two era. Source: Global Financial Data
P/E ratios with different combinations of earnings growth & expected return 4.0 5.0 6.0 4.5 --- 100 33 3.5 100 33 20 2.533 20 14 Expected return % Earnings growth % Trend
Real assets prices and total lending Source: Riksbanken