Download

1 / 12
120 likes | 227 Views
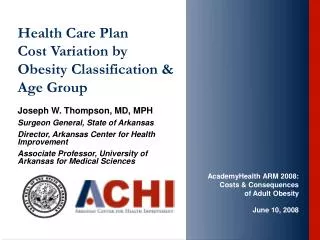
Health Care Plan Cost Variation by Obesity Classification & Age Group. Joseph W. Thompson, MD, MPH Surgeon General, State of Arkansas Director, Arkansas Center for Health Improvement Associate Professor, University of Arkansas for Medical Sciences.

E N D
Health Care Plan Cost Variation by Obesity Classification & Age Group Joseph W. Thompson, MD, MPH Surgeon General, State of Arkansas Director, Arkansas Center for Health Improvement Associate Professor, University of Arkansas for Medical Sciences AcademyHealth ARM 2008: Costs & Consequences of Adult Obesity June 10, 2008
Who is the CEO of the largest employer-based health insurance plan in your state?
Arkansas Public School Employees / State Employees Health Insurance Plan • Largest state-based insurance plan (~ 120,000 employees) • Major influence in the state on plan design, payment structure, network development • Self-insured plan with traditional benefit structure – no preventive coverage in 2003 • Aging work force with chronic illnesses • Escalating health insurance premiums • Lack of risk-management strategies ($1600/yr for smokers) • Decisions based on annual actuarial experience – no long-term strategy
Arkansas Public School Employees / State Employees Health Insurance Plan Charge to the plan: • Incorporate long-term management strategy for disease prevention/health promotion Three phases undertaken: 1) Awareness – Health Risk Appraisal (2004) • Tobacco, obesity, physical activity, seat belt use, binge drinking 2) Support – New benefit incorporation (2005) • first dollar coverage of evidence-based clinical preventive services • Tobacco cessation – Rx and counseling 3) Engagement – Healthy discounts (2006)
Self-Reported Risks (2006) HRA Respondents Eligible to Incur Claims (N=43,461) No Risks 11% P 10% O20% O+P9% Physically Inactive 21% Obese 32% C+O+P1% C+O2% C+P1.5% Daily Cigarette Users12% C7% O = Obese P = Physically Inactive C = Daily Cigarette Use Other Risks 39%
Average Annual Total Cost by Risk Factor No Risks $2,382 P $3,169 O $3,441 O+P $4,158 Obese $3,679 Physically Inactive $3,643 C+O+P $4,432 C+O $3,529 C+P $3,257 Daily Cigarette Users$3,081 C $2,690 O =Obese P = Physically Inactive C = Daily Cigarette Use
Average Annual Total Costs Linked to Obesity Total difference $1,297 (54% higher) Total costs Include medical (inpatient and outpatient) and pharmacy costs for 18-84 year old state employees. No risk = normal weight, physically active, non-smoker. Obese = BMI≥30.
$8,860 No Risk Obese $5,391 $3,765 $2,801 $2,160 $1,230 Average Annual Total Costs Linked to Obesity compared with Cost for No-Risk Group by Age Group $10,000 $9,000 $8,000 $4,522 (104%) $7,000 $6,000 $4,338 $5,000 $3,266 $4,000 $2,409 $1,991 $1,857 $3,000 $1,382 $2,000 $1,000 $0 18-24 25-34 35-44 45-54 55-64 65-74 Total costs include medical (inpatient and outpatient) and pharmacy costs for state employees.
Obesity Trends* Among U.S. AdultsBRFSS,1990, 1998, 2006 (*BMI 30, or about 30 lbs. overweight for 5’4” person) 1998 1990 2006 No Data <10% 10%–14% 15%–19% 20%–24% 25%–29% ≥30%
Conclusions and Policy Implications • Obesity-related costs increase with age and represent a major opportunity for cost containment and health improvement • Costs dramatically increase with age and are differentially higher for those who are obese. • Cumulative costs stratified by age and obesity classification may inform future actuarial projections for the plan and justify programmatic development.
Implications • Current health care financing constructs prevent support for early screening, prevention, and treatment • Fragmented child, adult, senior support • Onset of risk in child/adolescent period; cost impact as adults (maximum for Medicare) • Congressional House Pay-Go rules; Congressional Budget Office 10-year window for cost-projections • Without attention and a nationwide strategy to prevent and address precipitating behaviors known to cause disease, the financial viability of the health care financing system, particularly Medicare, is at risk.
Acknowledgements • ACHI staff and co-authors • Paula Card-Higginson, BA, ELS • Rhonda Jaster, MPH • Jennifer L. Shaw, MAP, MPH, DrPH • Sathiska D. Pinidiya, MEd, MS • Arkansas Employee Benefits Division