Download
1 / 14
140 likes | 250 Views
Learn about common errors, fraud risks, and best practices in financial reporting with spreadsheets. Explore case studies and methods to enhance quality control in financial services.

E N D
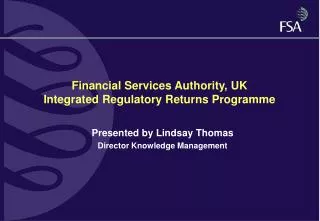
Financial Services Authority • Inspectors to recognise risks problems? errors , fraud frequency? where to look? • Best practice methods for companies No recognised best practice No training re: quality control
Customs & Excise : VAT • Most VAT Returns done on spreadsheets • 11% have errors • 2% are fraudulent
Enter as text i.e.’5000 This becomes 30,000 This becomes £5175
Allied Irish Bank / Allfirst • Cause • Fraud involving falsification of spreadsheets used for paying commission to dealer • Exchange Rates downloaded into spreadsheet from Reuters on-line feed deliberately hard-coded • Impact • Total US$691.2Million • False Bonus US$549,000 (not all paid)
=value/Spreadsheet2.Yen ie 1000 =value/Spreadsheet2.Rand ie 5 • Spreadsheet1:Value At Risk Projects Worked On • Proj Currency Value $ Value 1%Comm • Yen 100,000,000 $100,000 $1000 • Rand 500,000 $100,000 $1000 • 3 Euros 1,000,000 $2,000,000 $20,000 Spreadsheet2:Reuters Exchange Rates Yen to $ 1000 Rand to $ 5 Euro to $ 1 Should be $1,000,000 Comm $10,000 Hard-coded =value/.5
Research Areas Taxonomy of errors Development Life-Cycle Visual Aids Audit Approaches
A B C D E F G 1 Lazy Days Staff Budget Costs 1995-1996 2 Staff Day Work Night Work Total Average 3 Numbers Wages £ Wages £ Wages £ Wage £ 4 5 Managers 1 17700.50 0.00 17700.50 17700.50 6 Grade 1 3 45540.00 1400.55 46940.55 15646.85 7 Grade 2 9 122340.00 2000.00 124340.00 13815.56 8 Grade 3 12 102350.25 0.00 102350.25 8529.19 9 Grand Totals 25 287930.75 3400.55 291331.30 55692.09 10 11 Lazy Days Staff Budget Costs 1996 - 1997 12 Percentage wage Increases 13 Managers 2 14 Grade 1 1.5 15 Grade 2 1.5 16 Grade 3 1 17 18 Staff Day Work Night Work Total Average 19 Numbers Wages £ Wages £ Wages £ Wage £ 20 21 Managers 1 18054.51 0.00 18054.51 18054.51 22 Grade 1 3 46223.10 1421.56 47644.66 15881.55 23 Grade 2 9 124175.10 2030.00 126205.10 14022.79 24 Grade 3 12 103373.75 0.00 103373.75 8614.48 25 Grand Totals 25 291826.46 3451.56 295278.02 11811.12 26 27 Percentage Breakdowns for 1996-1997 28 Staff Basic Night Total 29 Nos % Wages % Wages % Wages % 30 of Numbers of Basic of Night of Grand 31 Grand Total Grand Total Grand Total Total 32 Managers 4.00 6.19 0.00 6.11 33 Grade 1 12.00 15.84 41.19 16.14 34 Grade 2 36.00 42.55 58.81 42.74 35 Grade 3 48.00 35.42 0.00 35.01 36 Totals 100.00 100.00 100.00 100.00
AIB / Allfirst • SpACE tool highlights suspicious entries
European Spreadsheet Risks Interest Group Conferences: 2000(Greenwich), 2001 (Amsterdam), 2002 (Cardiff), 2003 (Dublin), 2004(Klagenfurt), 2005(Greenwich) 2006(Cambridge)