Download
1 / 14
140 likes | 266 Views
Tropical Pacific Ocean forcing of the 1998 - 99 decadal shift in global precipitation. Lyon, Barnston , DeWitt, Climate Dynamics (revised). MAM 2011 PRCP Anomaly. MAM 1999-2011 AVG PRCP Anomaly East Africa MAM PRCP Anomaly. MAM Avg. SST Anomaly 1999-2012 MAM Avg. PRCP, V850

E N D
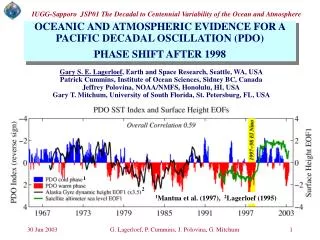
Tropical Pacific Ocean forcing of the 1998-99 decadal shift in global precipitation Lyon, Barnston, DeWitt, Climate Dynamics (revised)
MAM 2011 PRCP Anomaly MAM 1999-2011 AVG PRCP Anomaly East Africa MAM PRCP Anomaly
MAM Avg. SST Anomaly 1999-2012 MAM Avg. PRCP, V850 Anomalies 1999-2012 CMAP PRCP > 6 mm/day Red 1979-1998 Blue 1999-2011
1st EOF Loadings MAM PRCP 1979-2011 PC1
Linearly remove ENSO and GW Signals from ERSST (and HAD SST): Compute EOF of Residual Anomalies EOF1 Pacific Domain EOF1 Indo-Pacific Domain PCs and GW Trend
GPCC PRCP Difference: (1999-2010) minus (1977-1998) (1946-1976) minus (1977-1998) Statistically Significant Pooled PRCP Anomalies
EOF1 of R2 850hPa Wind for MAM 1979-2012 As Above but for 20CR (1930-2008) PCs
R2 Composite 200hPa Stationary Wave for MAM 1999-2012 EOF1 of R2 200 hPa Stationary Waves for MAM 1979-2012 PC1
Do Climate Model Simulations Capture the Recent Observed Patterns and the Shift? • Use the ECHAM4.5 (captures climo, used in IRI fcsts) • Full Simulations • POGA Runs (with slab ocean model)
PRCP Anomalies: (1999-2011) minus (1979-1998) Full Simulation POGA
Model PRCP Leading EOFs Full Simulation POGA PCs
EOFs of Model 850 hPa Wind Field Full Simulation POGA PCs
Composite and EOF of Model 200 hPa Stationary Waves POGA Composite 1999-2011 POGA EOF1 Loadings PC
Conclusions • A climate shift akin to that of 1976-77 occurred in 1998-99 • Shift is identified in multiple observational fields (PRCP, V850, SW200) • ECHAM4.5 simulations and POGA runs capture the salient, observed • features quite well • POGA runs are able to capture observed features, indicting the fundamental role • played by the tropical Pacific SSTs in generating teleconnections • For East Africa, results strongly suggest that multidecadal variability in the • Pacific is the main driver of the recent “long rains” decline - - - - - - - - - - - - - - - - - - - - - - - - - - • Interesting that in MAM the Pacific has direct relationship to East Africa • rainfall, vis-à-vis OND, when the progression is Pacific Indian East Africa. Why? • What are the physical mechanisms that lead to the rainfall decline in East Africa? • Are there additional factors leading to the severity of recent MAM droughts in EA? • Climate Change A wetter East Africa? What do the models get right (now)?