Download
1 / 44
470 likes | 707 Views
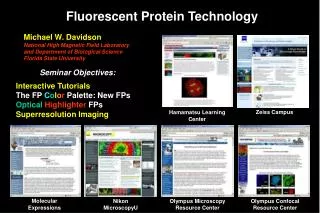
Fluorescent Protein Technology. Michael W. Davidson National High Magnetic Field Laboratory and Department of Biological Science Florida State University. Seminar Objectives: Interactive Tutorials The FP C o l o r Palette: New FPs Optical Highlighter FPs

E N D
FluorescentProtein Technology Michael W. Davidson National High Magnetic Field Laboratory and Department of Biological Science Florida State University Seminar Objectives: Interactive Tutorials The FP Color Palette: New FPs OpticalHighlighter FPs Superresolution Imaging Zeiss Campus Hamamatsu Learning Center Molecular Expressions Nikon MicroscopyU Olympus Microscopy Resource Center Olympus Confocal Resource Center
Fluorophore Candidates for Live-Cell Imaging & FRET Assays Spectral Width ~30 nm Genetically Encoded Spectral Width ~30-50 nm Spectral Width ~40-100 nm Synthetics Live-Cell Imaging Requires Specificity, Low Background, and Photostability
Fixed cells are perfect targets: They don’t move! Precise Spatial Information Emission Range = 350 + nm
Live-Cell Imaging for Temporal and Spatial Investigations mKO – H2B in RK-13 Cells mEYFP – ER in U2OS Cells Laser Scanning Confocal Microscopy (FV300) 30 second Time Lapse Interval Spinning Disk Confocal Microscopy (DSU) 2 Second Time Lapse Interval
Fluorescent Protein Timeline Roger Tsien Osamu Shimomura Day and Davidson Chem. Soc. Rev. In Press (2009) Martin Chalfie
Fluorescent Protein Sources Reef Corals Jellyfish (Aequorea) Copepods Amphioxus
Fluorescent Protein b-Barrel Structure Aequorea victoria GFP 238 Amino Acids Tightly Packed Core excludes water, ions, & other intruding small molecules 11 b-Strands capped with a-helicies Chromophore Is a cyclic tripeptide GFP absorbs blue light emits green light FP Barrel can reduce FRET Efficiency by ~ 40-60%
Mouse Nidogen G2 Domain Nidogen is an invariant multifunctional component of the basement membrane that binds collagen and perlecan. The G2 domain is highly conserved.
wtGFP versus Enhanced GFP Spectral Properties GFP-S65T wtGFP 395 nm – Neutral Chromophore 475 nm – Phenolate Chromophore Bimodal absorption eliminated by replacing serine with threonine at position 65 Emission FWHM ~ 40-50 nm
Enhanced GFP Chromophore Formation Secondary folding of polypeptide backbone Cyclization – elimination of a water molecule Molecular Oxygen required for dehydration of Tyr66 Folds into a tightly woven 11-stranded b-barrel Excludes water, ions, & other intruding small molecules Tsien (1998) Ann Rev Biochem. 67:509
Mutant Color Variants Based on avGFP Mutations to aromatic residue (tyrosine) at position 66 affect color Serine, Glycine, or Threonine at position 65 – Glycine 67 invariant Other Improvements: Maturation at 37°C Protein Folding Mutations Fine-Tuning Emission Properties Environmental Sensitivity Reduced Dimerization Blue to yellow FP palette covers ~80 nm emission range
Improved GFPs Through Mutagenesis ~75% mutations occur in strands 7, 8, & 10 l mutations occur near central a-helix Cyan and Yellowmutations at termini from CyPet & YPet A206K avGFP common “monomerizing” mutation Folding mutations occur throughout the sequence
Oligomerization in Fluorescent Proteins Oligomerization interferes with proper localization in fusions that form biopolymers Oligomerization produces aggregation in live cells
Work-Arounds for Oligomerization Artifacts In some cases, tetramers and dimers don’t affect localization A D Histone H2B Fusions with Monomeric FPs Tandem Dimer may work similar to a monomer but at twice the size
Mutant Color Variants Based on Coral RFPs MYG ~ 180 nm; QYG ~ 140 nm; TYG ~ 90 nm; CYG ~80 nm Coral-derived FP palette covers ~200 nm emission range
Improved RFPs Through Mutagenesis DsRed FP Mutation Map Many red proteins contain “monomerizing” mutations in Strands 6, 8 & 9 mCherry mutations occur near chromophore Folding mutations occur throughout sequence
The “mFruit” Proteins are Ideal for Live-Cell Imaging mCherry – Actin fusion expressed in Rabbit Kidney (RK-13) Cells 543 nm; LSCM; 30-second TL; 24 hour observation; 40x Oil
Target areas for Improvement to Create “Ideal” FPs • Must be nontoxic, express efficiently, and have sufficiently bright signal above background. • FPs must not self-associate and should be photostable over the time period of the experiments. • FPs should be insensitive to their environment and have minimal crosstalk with other probes. • New FPs having advanced properties with emission spectral profiles in the orange, red, and near-infrared are needed.
Properties of the BEST Fluorescent Protein Variants Shaner et al.Journal of Cell Science 120: 4247 (2007) Day and Davidson Chemical Society Reviews in press (2009)
Fusion of Target Proteins with Fluorescent Proteins EGFP-alpha-Tubulin In Rat Aorta Cells
Is the Fluorescent Protein-Tagged Protein Functional? EB3-YPet Fusion Expressed in Fox Lung Fibroblast Cells End-Binding Protein-3 Tracks Microtubule Dynamics (+ End) 488-nm Excitation; Nikon Swept Field Confocal; -80 EMCCD; NA=1.45
Examples of Functional Fusions in Action Spinning Disk LSCM mCherry-H2B & mEGFP-Tubulin In LLC-PK1 (Pig Kidney) Cells mEGFP-Connexin 43 In HeLa (CCL2) Cells
Examples of Functional Fusions in Action LSCM LSCM mApple-H2B & mEmerald-ER In LLC-PK1 (Pig Kidney) Cells mCherry-H2B & mEGFP-Mito In Opossum Kidney (OK) Cells
Multi-Color Imaging with Fluorescent Proteins EBFP2-H2B; mTFP1-Golgi; mCitrine-Mito; mCherry-Peroxisomes; mPlum-Zyxin
Photoactivatable (PA) GFP The wtGFP T203H can be photoconverted from absorbance at 395 nm to absorbance at 504 nm by intense illumination at 405 nm Patterson et al. (2002) Science 297:1873
PA-GFP in Action: FRAP Alternative Photoactivation (405) nm 5 min 15 min 30 min Problem: Native PA-GFP Difficult to visualize
Optical Highlighter Fluorescent Proteins Photoactivation PA-GFP –Monomer PS-CFP – Monomer Green to Red Photoconversion Kaede –Tetramer Eos – Tandem Dimer Dendra –Monomer KikGR –Tetramer Photoswitching Dronpa –Monomer KFP1 – Tetramer mTFP0.7 –Monomer
Photoconversion in Optical Highlighters Green => Red Photoconversion Kaede FP in Hamster Kidney (BHK) Cells
Optical Highlighters as Organelle Trackers Green => Red Photoconversion dEosFP-Mito in Rabbit Kidney (RK-13) Cells
Optical Highlighters as Optical Switches 405 nm Photoswitch = ON 488 nm Photoswitch = OFF Dronpa FP – Actin in Rat Thoracic Aorta Cells (A7r5)
Kindling Fluorescent Protein – Optical Switch 543 nm Photoswitch = ON 488 nm Photoswitch = OFF KFP1-Mitochondria in Fox Lung Fibroblast Cells
Optical Highlighters in PALM Photoactivated Localization Microscopy Widefield TIRF Images PALM Image Tandem dimer-Eos-Vinculin in Fox Lung Fibroblast Cells
Optical Highlighters in PALM Photoactivated Localization Microscopy 1. Photoactivate and image PA species single molecules with high precision 2. Photobleach and repeat step 1 until all molecules are expended 3. Localize single molecule centers and construct super-resolution image
Optical Highlighters in PALM Photoactivated Localization Microscopy • Photoactivate and image PA species single molecules with a high degree • of precision • Photobleach and repeat step 1 until all molecules are expended • Localize single molecule centers and construct super-resolution image
Fluorescent Proteins: What’s the Future? Better engineered Jellyfish and Coral FPs