Clustering & Classification of Aerosol Types from Space Using Absorption Angstrom Exponent: A Multidimensional Approach
This study explores a method combining specified clustering and Mahalanobis classification to identify various aerosol types by utilizing multiwavelength optical information. By examining Absorption Angstrom Exponent and other parameters, aerosols are assigned into classes such as Urban-Industrial, Biomass-Burning, Mineral Dust, and Asian Urban. The technique is tested on AERONET data sets and aircraft-sampled aerosols, showing skill scores ranging from 87% to 100%. Future steps include refining classification algorithms, extending tests to more sites, and incorporating data from other sensors for improved accuracy. The study aims to enhance remote identification of aerosol types for better environmental monitoring and analysis.

Clustering & Classification of Aerosol Types from Space Using Absorption Angstrom Exponent: A Multidimensional Approach
E N D
Presentation Transcript
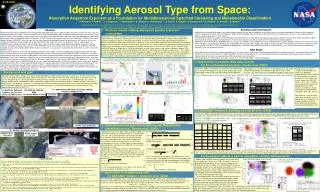
A11E-0091 Identifying Aerosol Type from Space: Absorption Angstrom Exponent as a Foundation for Multidimensional Specified Clustering and Mahalanobis Classification P. Russell1, P. Hamill 2, J. Livingston3, Y. Shinozuka1,4, A. Strawa1, J. Redemann1,4, A. Omar5, A. Clarke6, R. Bergstrom1,4, B. Holben7, R. Ferrare5, S. Burton5 1NASA Ames Research Center, Moffett Field, CA (Philip.B.Russell@nasa.gov), 2San Jose State University, San Jose, CA, USA, 3SRI International, Menlo Park, CA, 4B ay Area Environmental Research Institute, Sonoma, CA, 5NASA Langley Research Center, Hampton, VA, USA, 6SOEST, University of Hawaii, Honolulu, HI, USA, 7NASA Goddard Space Flight Center, Greenbelt, MD, USA • Summary and Conclusions • Specified clustering and Mahalanobis classification together provide a useful way of combining several dimensions of multiwavelength optical information (e.g., Absorption Angstrom Exponent, Extinction Angstrom Exponent, Single Scattering Albedo, Real and Imaginary Refractive Index) to assign aerosols to classes (e.g., Urban-Industrial, Biomass-Burning, Mineral Dust, Asian Urban). • The specified or “reference” clusters can be established using information (e.g., trajectories, accompanying trace gases, chemical analyses, prior studies) beyond the optical information that will be available in the general case. These reference clusters can then be used to test the skill of a classification algorithm. • Applications of the technique to 2 AERONET data sets and aircraft-sampled aerosols yielded skill scores ranging from 87% to 100% (diagonal elements of the skill score matrix). • A first step toward simulating Glory APS data, by using bimodal aerosol models with randomly generated errors based on Glory APS expected uncertainties, yielded skill scores of 71% to 99%, with 0% to 12% of simulated points assigned to an “unknown” class (defined as consisting of points with DMahal>3 from all 4 reference clusters based on 4 AERONET sites and associated seasons). • Next Steps • Refine filtering rules for reference clusters and definition of “unknown” class to yield a robust classification algorithm with a sound physical basis and relatively high skill scores. • Extend tests to more of the Cattrall et al. (2005) AERONET sites and retrieved parameters, to test parameter usefulness and the generality of aerosol type assignments. • Improve fidelity of simulations to expected Glory APS data products and uncertainties. • Extend input data sets to parameters from other sensors (e.g., CALIOP layer heights, OMI UV absorption). 2. Previous results relating absorption spectra & aerosol composition Abstract Determining either aerosol composition or multiwavelength absorption from space is difficult at best, but recent research on many fronts has improved prospects for success. Results from diverse air, ground, and laboratory studies using both radiometric and in situ techniques show that the fractions of black carbon, organic matter, and mineral dust in atmospheric aerosols affect the wavelength dependence of absorption (often expressed as an Absorption Angstrom Exponent, or AAE). Recent results include analyses of the Dubovik et al. (2002) set of Aerosol Robotic Network (AERONET) retrievals from Sun-sky measurements describing full aerosol vertical columns. AAE values in this set are strongly correlated with aerosol composition or type. Specifically, AAE values are near 1 (the theoretical value for black carbon) for AERONET-measured aerosol columns dominated by urban-industrial aerosol, larger (though partially overlapping) for biomass burning aerosols, and largest for Sahara dust aerosols. These AERONET results are consistent with results from other, very different, techniques, including solar flux-aerosol optical depth (AOD) analyses and airborne in situ analyses examined in this presentation, as well as many other previous results. Although AAE is therefore a useful tool for helping to distinguish aerosol types, it cannot unambiguously distinguish urban-industrial from biomass burning aerosols, even when supplemented by measurements of Extinction Angstrom Exponent (EAE). Hence there is a need to add information from other remotely sensible properties to improve remote identification of aerosol type. Specified clustering, combined with Mahalanobis classification, provides an objective way of using multiple dimensions of data for this purpose. We demonstrate the application of this technique (previously used with High Spectral Resolution Lidar data) to (1) the Dubovik (2002) AERONET data set, (2) an in situ data set, and (3) a larger Version 2 AERONET data set. Results show that combining AAE and EAE with variables such as real and/or imaginary refractive index (RRI, IRI) or single scattering albedo (SSA) can improve separation of urban-industrial from biomass burning aerosols. The soon-to-be-launched Glory Aerosol Polarimetry Sensor (APS) is expected to produce data sets amenable to this aerosol classification technique, especially when combined with OMI aerosol absorption measurements at shorter wavelengths and CALIPSO measurements of aerosol height, to reduce height-absorption aliasing. Bergstrom et al. (2007) used airborne measurements of solar flux and AOD spectra to show (Fig. 2A) that (1) mineral dust, urban-industrial, and biomass burning aerosols have distinct spectra of SSA, (2) the different shapes of SSA spectra often convert to power-law spectra of absorption optical depth, with near-constant exponent (Absorption Angstrom Exponent, or AAE), and (3) AAE for urban-industrial aerosols is often near 1 (the value for black carbon), whereas AAE values are larger for biomass burning aerosols and largest for desert dust. These results are similar to those (Fig. 2B) obtained by Shinozuka et al. (2009) using very different analysis techniques on aircraft-sampled aerosols. Russell et al. (2010, Fig. 2C) showed that the AERONET data set of Dubovik et al. (2002), describing full aerosol vertical columns, had similar connections between AAE and aerosol type, albeit with some overlap between AAE values for urban-industrial and biomass-burning sites. They showed further that combining AAE with Extinction Angstrom Exponent (EAE) in a 2-dimensional plot (Fig. 2D left frame) still yielded partial overlap between urban-industrial (UrbInd) and biomass-burning (BioBurn) clusters, raising the question of whether the clusters could be separated by using other parameters from the AERONET retrieval set in analyses of higher dimension. 4. Application to example data sets (cont’d) 4.2 Aircraft-sampled aerosols, Clarke et al. (2007) 4.3 AERONET Version 2, building on Cattrall et al. (2005) 0.1 0.01 0.001 1.00 0.95 0.90 0.85 0.80 0.75 1.0 0.9 0.8 0.7 0.6 0.5 1 0.1 0.01 0.001 Aerosol Absorption Optical Depth Single Scattering Albedo Aerosol Absorption Optical Depth Single Scattering Albedo Clarke et al. (2007) used analyses of simultaneously-sampled trace gases and other information to assign aircraft-sampled dry aerosols to the 3 types shown in Fig. 4.2A. We used the Clarke data and designations as a reference set (i.e., 3 specified clusters) and tested how well Mahalanobis classification assigns points to the Clarke clusters. Fig. 4.2B shows that using AAE,SSA produces more cluster overlap and, in most cases, smaller 2-D Mahalanobis skill scores than AAE,SAE. Combining AAE, SAE, & SSA in a 3-D Mahalanobis classification produces 3-D skill scores (inset matrix) smaller than AAE,SAE scores in most cases, signaling that caution must be used when adding dimensions. (Note, however, that SSA at a shorter wavelength may provide better separation—See Figs. 2A & 2C.) Note also that, since the Clarke (2007) data are for dry aerosol, ambient RH will shift positions of Pollution, BioBurn, and Dust points differently, affecting their relationship to AERONET results. 1. Background and goal AAOD = K l-AAE 300 700 1100 4.2A. 2-D Mahalanobis classification of Clarke data: AAE,SAE 4.2B. 2-D Mahalanobis classification of Clarke data: AAE,SSA • 500 1100 • Wavelength, nm Sometimes aerosol type in imagery from space can be identified by tracing the aerosol back to its source (e.g., 1A, 1B). In other cases (e.g., 1C) the apparent color (absorption spectrum) distinguishes mineral dust aerosol from other aerosol types. In still other cases (e.g., 1D) it is tempting to guess aerosol type based on aerosol location. However, this can lead to errors, as exemplified by 1E, in which Alaskan wildfire smoke, carried down the Mississippi Valley, along the Gulf Coast and up the Atlantic seaboard, caused a haze layer off New England. The goal of this research is to develop robust methods for identifying aerosol type from the optical information retrievable from an individual image pixel. To test methods we use optical parameters similar to those expected to be retrieved from the Glory Aerosol Polarimetry Sensor (APS, 1F). • 500 700 1100 1700 • Wavelength, nm • 500 700 900 1100 1300 1700 • Wavelength, nm 1C. Sahara dust, NW Africa & Canary Islands Viewed from MODIS on Terra 1B. Alaskan wildfires, 2004 Viewed from MODIS on Terra 1A. Southern California wildfires, 26 Oct 2003 Viewed from MISR on Terra 2D. Different 2-D plots of Dubovik (2002) AERONET full-column results, showing different separations of clusters 24 Jul 2003 1D. Urban-industrial pollution? Cattrall et al. (2005) analyzed AERONET data for 26 sites/seasons, which they designated as urban/industrial (here abbreviated UrbInd), biomass burning (BioBurn), SE Asian (AsiaUrb), dust, and maritime. We chose the sites/seasons in Table 4.3 to explore Mahalanobis classification, using AERONET Version 2 data for the years shown. Table 4.3. AERONET sites and months from Cattrall et al. (2005) selected to explore Mahalanobis classification 4.3B. 5-D Mahalanobis classification of Bahrain data 4.3A. 2-D Mahalanobis classification for 4 Cattrall sites Boundary: DMahal to Dust = DMahal to AsiaUrb 5 Dimensions: EAE (440, 870 nm), AAE (440, 870), SSA (441), RRI (441), IRI (441) GSFC (UrbInd) 3. Multidimensional specified clustering and Mahalanobis classification (e.g., Ferrare et al., 2010) Atlantic coast of N America Solar Village (Dust) 1E. Smoke from Alaska wildfires 1F. The A-Train with Glory Boundary: DMahal to UrbInd = DMahal to BioBurn In 2 dimensions (1) reduces to (3) Notice the similarity of (3) to the exponent of the bivariate normal probability distribution, (4) Comparing (3) and (4) yields (5) Curves of constant DM are ellipses. The integral of f(x,y) over such an ellipse is the probability P(DM) that a random point from the cluster lies within the ellipse (provided points are bivariate-normally distributed). Fig. 2D shows examples of such ellipses. (6) over an ellipse of constant DM Specified clustering (e.g., Moussiades and Vakali, 2009) uses “a priori” information in a “reference” data set to assign points to clusters. This a priori information can include information (e.g., trajectory or chemical analyses or previous studies) beyond the optical parameters that will be available to the classification method in the general case. In Fig. 2D we assigned points to clusters (symbol colors) using the aerosol type designations of Dubovik et al. (2002); this is an example of specified clustering. Mahalanobis classification (AI Access, 2010; Wikipedia, 2010) assigns any given N-dimensional point (x1,x2,…,xN)Tto the cluster that has minimum Mahalanobis distance, DM, from that point. For purposes of defining DM, a cluster is defined by its mean (m1,m2,…,mN)T and its covariance matrix S. In N dimensions, (1) where the elements of S are given by (2) si is the standard deviation of xifor all points in the cluster, and rij is the correlation coefficient of xiand xj. MODIS on Aqua 21 Jul 2004 MODIS on Terra 19 Jul 2004 Mongu (BioBurn) DM of Bahrain data point to specified cluster Boundary: DMahal to BioBurn= DMahal to AsiaUrb Beijing (AsiaUrb) 4 Specified Sites (Types): . Mongu (BioBurn) . GSFC (UrbInd) . Beijing (AsiaUrb) . Solar Village (Dust) Years after 1 January 2004 For each site, we filtered points to exclude outliers (here defined as points with DM>3). Boundaries in Fig. 4.3A trace the locus points having equal Mahalanobis distance to 2 sites. In Fig. 4.3B, 5-dimensional Mahalanobis classification assigns 89% of Bahrain points to the Solar Village (Dust) cluster and 11% to the Beijing (AsiaUrb) cluster. 4.4 Aerosol models as a path to simulation of Glory APS products References Models used in MODIS retrievals combine a fine mode and a coarse mode (e.g., Remer et al., 2005). Diamonds in Fig. 4.4A show SSA,EAE coordinates of fine and coarse modes for the MODIS over-ocean set (modes 1-9), augmented with increased absorption (modes 10-18) and adjusted size (modes 19, 20). Lines connecting a fine and a coarse mode show coordinates of weighted combinations of those modes. Together the lines cover the SSA,EAE space of the AERONET clusters from the 4 Cattrall sites in Fig. 4.3A (replotted in Fig. 4.4A). To investigate effects of the Glory APS retrieval uncertainties in Fig. 1F, we started with an augmented MODIS bimodal model (point on a line in Fig. 4.4A) approximating the mean of each cluster, normalized to yield AOD(550 nm)=0.5. We then added random uncertainties with standard deviations from Fig. 1F. 4.4A. Bimodal models, with clusters 4.4B. Simulated measurements and classifications AI Access, Mahalanobis distance, http://www.aiaccess.net/English/Glossaries/GlosMod/e_gm_mahalanobis.htm , 2010. Bergstrom, R. W., et al., Spectral absorption properties of atmospheric aerosols, Atmos. Chem. Phys., 7, 5937-5943, 2007. Bergstrom, R. W., et al., Aerosol spectral absorption in the Mexico City area: results from airborne measurements during MILAGRO/INTEX B, Atmos. Chem. Phys., 10, 6333-6343, 2010. Cattrall, C., et al., Variability of aerosol and spectral lidar and backscatter and extinction ratios of key aerosol types derived from selected Aerosol Robotic Network locations, J. Geophys. Res., 110, D10S11,doi:10.1029/2004JD005124, 2005. Clarke, A., et al., Biomass burning and pollution aerosol over North America: Organic components and their influence on spectral optical properties and humidification response, J. Geophys. Res., 112, D12S18, doi:10.1029/2006JD007777, 2007. Dubovik, O., et al.: Variability of absorption and optical properties of key aerosol types observed in worldwide locations, J. Atmos. Sci., 59, 590–608, 2002. Ferrare, R., C. Hostetler, S. Burton et al., Aerosol classification of airborne High Spectral Resolution Lidar measurements, ms in preparation, Sharon.P.Burton@NASA.gov, 2010. Miller, S. D., A consolidated technique for enhancing desert dust storms with MODIS, Geophys. Res. Lett., 30(20), 2071, doi:10.1029/2003GL018279, 2003. Mishchenko, M., et al.: Accurate monitoring of terrestrial aerosols and total solar irradiance, B. Am. Meteorol. Soc., 88(5), 677–691, 2007. Moussiades , L., and A. Vakali, Benchmark graphs for the evaluation of clustering algorithms , 3rd Int’l Conf. Research Challenges in Information Science, Fez, Morocco, DOI 10.1109/RCIS.2009.5089283, 22-24 April 2009. Remer, L. A., et al. (2005), The MODIS aerosol algorithm, products, and validation, J. Atmos. Sci., 62, 947–973, doi:10.1175/JAS3385.1 Russell, P. B., et al., Absorption Angstrom Exponent in AERONET and related data as an indicator of aerosol composition, Atmos. Chem. Phys., 10, 1155-1169, 2010. Shinozuka, Y., et al.: Aerosol optical properties relevant to regional remote sensing of CCN activity and links to their organic mass fraction: airborne observations over Central Mexico and the US West Coast during MILAGRO/INTEX-B, Atmos. Chem. Phys., 9, 6727–6742, 2009. Wikipedia, Mahalanobis distance, http://en.wikipedia.org/wiki/Mahalanobis_distance , 2010. 4. Application to example data sets 4.1 AERONET Version 1, Dubovik et al. (2002) The Mahalanobis probability ellipses in Fig. 2D show that the 2-D set RRI,AAE (right frame), obtained by combining Real Refractive Index (RRI) with AAE, provides better separation of clusters than the 2-D set EAE,AAE (left frame). One measure of success in cluster separation is the skill score matrix, examples of which are shown in Fig. 2D. Elements are defined as (7) where NSk is the number of points in the specified (Dubovik) class k and NMklis the number of points from Dubovik class k that Mahalanobis classification assigns to Dubovik class l. The 3-D set EAE,AAE,RRI (not shown) provides even better separation, as measured by larger differentiation in Mahalanobis distances than achieved with either 2D set. Resulting clusters (10,000 points each) are shown in Fig. 4.4B with boundaries from the Cattrall-site clusters in Fig. 4.4A. Mahalanobis classification using those boundaries produces the skill scores shown in Fig. 4.4B. Points classified as “unknown” have DM>3 (P(DM)<1%) for all 4 Cattrall-based clusters.