Download
1 / 11
110 likes | 206 Views
Learn about sinewaves, their characteristics, and applications in science, engineering, and mathematics. Explore concepts like amplitude, frequency, phase, and Fourier analysis. Engage with simulations to deepen your understanding.

E N D
Transmitting Signals First Meeting
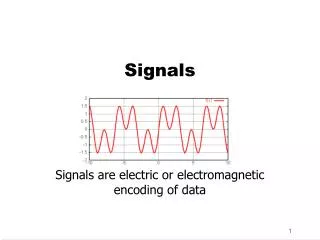
Signal Processing: Sinewaves • Sinewave is a fundamental tool in many areas of science, engineering and mathematics • A periodically repeating curve whose shape when plotted. • The horizontal axis is time, t, • The graph shows how the property y varies as time passes. • Example: In electrical signal in a wire, y is the voltage in the wire. • The shape shown in the graph can be created by rotating a line of length a at a constant speed about a fixed pivot O: Simulation
Sinewave: Not Symetrical • Sometimes a sinewave does not oscillate symmetrically about the horizontal axis. • In an electrical signal: • y represented voltage, • A sinusoidal variation of voltage above and below c, rather than above and below 0.
Sinewave: Amplitude • The amplitude is the maximum displacement of the sinewave from its mean (average) position. Simulation
Sinewave: Cycle, Frequency and Period • Frequency (f) • The number of cycles per second, • Example: A sinewave with 5 cycles per second is said to have a frequency of 5 Hz (hertz) • Cycle • The basic shape of the waveform that repeats indefinitely. • Period (T) • The time taken to complete one cycle • T = 1/f • The mains electricity supply is sinusoidal, with a frequency of 50 Hz. What is T? • 1/50 = 0.02 s One Cycle Simulation
Sinewave: Phase • Phase, or, more correctly, phase shift, • Is how far a sinewave is shifted along the horizontal axis relative to another sinewave taken as a reference • The blue sinewave is shifted 1/4 cycle to the right of the reference sinewave • If a sinewave to be generated by the rotating line a, then a sinewave lagging by a quarter of a cycle is generated by a line b at 90 degrees to line a. • (Ninety degrees = ¼ cycle) why? • because a complete revolution, 360 degrees, corresponds to one complete cycle of a sinewave.) Simulation
Sinewave: Equation • y = a sin(2πft + φ) • y represents displacement at time t • a represents the amplitude • f is the frequency and • φ is the phase • The term (2πft + φ) represents an angle that is growing as time passes. • This angle is measured in radians rather than degrees. • For the following sinewave, it is clear that the amplitude a has the value 5 volts. The values f and φ are not so obvious. • φ is a quarter of a cycle is 90 degrees, or π/2 radians. • Since hhe sinewave lags behind the reference sinewave, so φ = – π/2 radians. (radian = 57.3 degrees) The equation for the sinewave is: y = 5 sin(200πt – π/2) volts
Radian • 1 radian ≈ 57.3 degrees • The circumference of a circle has a length of 2 π r, • One complete rotation = 2 π radians. • 2 π radians =360 degrees • one radian = (360/2 π) degrees.
Fourier's theorem • The theorem states that any periodic signal can be thought of as a sum of a number of sinewaves of different amplitudes, frequencies and phases. • Adding sinewaves together creates non-sinusoidal waveforms. This process is known as Fourier synthesis. a+b+c Simulation
a+b+c Fourier's theorem: Analysis • Fourier analysis is the process of analyzing periodic non-sinusoidal waveforms in order to determine their component sinewaves. • Fourier analysis generally involves fairly advanced mathematics • It is simply a matter of looking at each term in the series of additions and interpreting it as one of the component sinewaves
Next Week • Fourier Spectrum • Signal Processing (Bandwidth, Digitization) • Modulation and Multiplexing • Error Detection and Correction