Download
1 / 15
150 likes | 306 Views
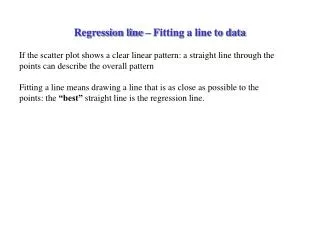
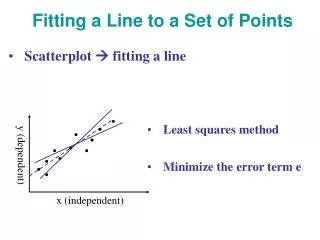
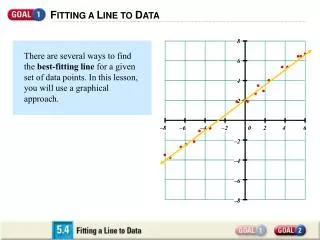
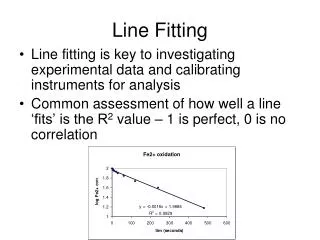
Line Fitting. Line fitting is key to investigating experimental data and calibrating instruments for analysis Common assessment of how well a line ‘fits’ is the R 2 value – 1 is perfect, 0 is no correlation. Data Quality.

E N D
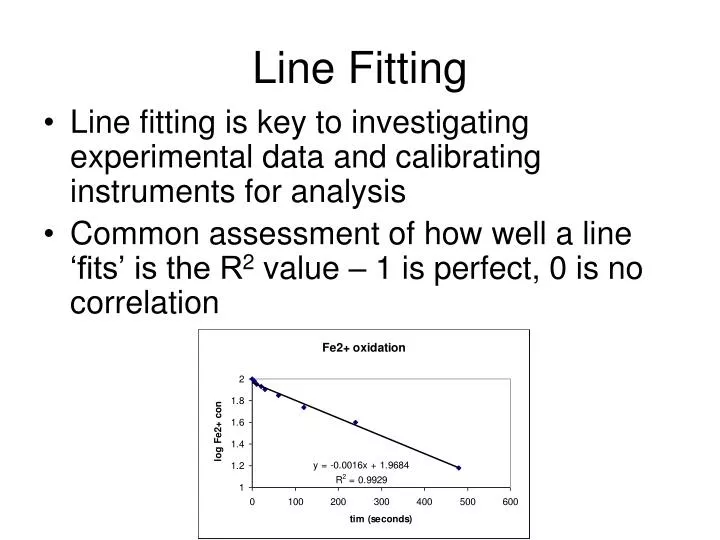
Line Fitting • Line fitting is key to investigating experimental data and calibrating instruments for analysis • Common assessment of how well a line ‘fits’ is the R2 value – 1 is perfect, 0 is no correlation
Data Quality • “Error” – how well do we know any number? What would replicate measurements tell us? • Standard Deviation, s
Error Accumulation • Any step of an analysis contains potential ‘error’: • Diluting a sample for analysis has error – type B volumetric flask for example is 250ml ± 0.25 ml for example (1 s) • Weighing a salt to make a standard also has “error” 1.245 g ± 0.001 for example • Addition of error:
Units review • Mole = 6.02214x10²³ ‘units’ make up 1 mole, 1 mole of H+= 6.02214x10²³ H+ ions, 10 mol FeOOH = 6.02214x1024 moles Fe, 6.02214x1024 moles O, 6.02214x1024 moles OH. A mole of something is related to it’s mass by the gram formula weight Molecular weight of S = 32.04 g, so 32.04 grams S has 6.02214x10²³ S atoms. • Molarity = moles / liter solution • Molality = moles / kg solvent • ppm = 1 part in 1,000,000 (106) parts by mass or volume • Conversion of these units is a critical skill!!
Let’s practice! • 10 mg/l K+ = ____ mM K • 16 mg/l Fe = ____ mM Fe • 10 mg/l PO43- = _____ mM P • 50 mm H2S = _____ mg/l H2S • 270 mg/l CaCO3 = _____ M Ca2+ • FeS2 + 2H+ Fe2+ + H2S 75 mM H2S = ____ mg/l FeS2 • GFW of Na2S*9H2O = _____ g/mol • how do I make a 100ml solution of 5 mM Na2S??
Scientific Notation • 4.517E-06 = 4.517x10-6 = 0.000004517 • Another way to represent this: take the log = 10-5.345
Significant Figures • Precision vs. Accuracy • Significant figures – number of digits believed to be precise LAST digit is always assumed to be an estimate • Using numbers from 2 sources of differing precision must use lowest # of digits • Mass = 2.05546 g, volume= 100.0 ml = 0.2055 g/l
Logarithm review • 103 = 1000 • ln = 2.303 log x • pH = -log [H+] 0.015 M H+ is what pH? • Antilogarithms: 10x or ex (anti-natural log) • pH = -log [H+] how much H+ for pH 2?
Logarithmic transforms • Log xy = log x + log y • Log x/y = log x – log y • Log xy = y log x • Log x1/y = (1/y) log x ln transforms are the same
Review of calculus principles • Process (function) y driving changes in x: y=y(x), the derivative of this is dy/dx (or y’(x)), is the slope of y with x • By definition, if y changes an infinitesimally small amount, x will essentially not change: dy/dk= • This derivative describes how the function y(x) changes in response to a variable, at any very small change in points it is analogous to the tangent to the curve at a point – measures rate of change of a function
Differential • Is a deterministic (quantitative) relation between the rate of change (derivative) and a function that may be continually changing In a simplified version of heat transfer, think about heat (q) flowing from the coffee to the cup – bigger T difference means faster transfer, when the two become equal, the reaction stops
Partial differentials • Most models are a little more complex, reflecting the fact that functions (processes) are often controlled by more than 1 variable • How fast Fe2+ oxidizes to Fe3+ is a process that is affected by temperature, pH, how much O2 is around, and how much Fe2+ is present at any one time what does this function look like, how do we figure it out???
Total differential, dy, describing changes in y affected by changes in all variables (more than one, none held constant)
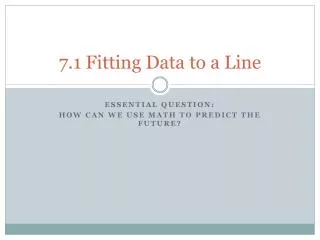
monalbite anorthoclase 1100 high albite Temperature (ºC) sanidine 900 intermediate albite 700 orthoclase low albite microcline 500 Miscibility Gap 300 10 30 70 50 90 Orthoclase KAlSi3O8 Albite NaAlSi3O8 % NaAlSi3O8 ‘Pictures’ of variable changes • 2 variables that affect a process: 2-axis x-y plot • 3 variables that affect a process: 3 axis ternary plot (when only 2 variables are independent; know 2, automatically have #3)