National-Income Accounting
730 likes | 1.13k Views
National-Income Accounting. Chapter 5. Chapter Overview. Part 2: Measuring Macro Outcomes: 5. National-Income Accounting : 6. Unemployment 7. Inflation. Chapter Overview. 5. National-Income Accounting : 1. Measures of Output (Review of GDP, +…). 2. The Uses of Output

National-Income Accounting
E N D
Presentation Transcript
National-Income Accounting Chapter 5
Chapter Overview Part 2: Measuring Macro Outcomes: 5. National-Income Accounting: 6. Unemployment 7. Inflation
Chapter Overview 5. National-Income Accounting: 1. Measures of Output (Review of GDP, +…). 2. The Uses of Output (Review: GDP = C+I+G+(X-M)). 3. Measures of Income.
Measures of Output (Review of GDP).
Measures of Output • National-income accounting: • the measurement of aggregate economic activity, • particularly national income and its components. • These are Macroeconomic measures. • Why are economists interested in these measures? …
Gross Domestic Product (GDP) • Gross domestic product (GDP): • is the total dollar value of final output produced within a nation’s borders in a given time period. LO1
Gross Domestic Product (GDP) • Each good and service produced and brought to market has a price. That price serves as a measure of value for calculating total output. LO1
GDP Versus GNP • GDP: • geographically focused, • includes all output produced within a nation’s borders, … • regardless of whose factors of production are used to produce it (foreign or domestic). LO1
GDP Versus GNP • GNP - Gross National Product : • theold standard of measure, • refers to output produced by American-owned factors, regardless of location • GDP is the new standard of measure since 1992. GNP is dead I say! - It’s over! LO1
International Comparisons • The geographic focus of GDP facilitates international comparisons of economic activity. LO1
GDP per Capita • REVIEW: • GDP per capita: • total GDP divided by total population (average GDP). • commonly used as a measure of a country’s standard of living.
GDP per Capita • However: • Measures of per capita GDP tell us nothing about the way GDP is actually distributed or used, • It is only a statistical average.
Measurement Problems • The methods of calculating GDP create several problems: • Non-market activities. • Unreported income. • Value added (double counting). • Price fluctuations (real vs. nominal).
Non-Market Activities • GDP measures exclude most goods and services produced that are not sold in the market. • This causes GDP to be understated. • Exclusion of non-market activities causes problems when: • comparingliving standards over time, • or between countries. LO1
Unreported Income • The GDP statistics fail to capture market activities that are not reported to tax or census authorities. • The underground economy is motivated by tax avoidance or to conceal illegal activities. LO1
Value Added • The production of most goods and services involves a series of stages. • To accurately measure GDP we must distinguish between two types of goods: • intermediate goods, and… • final goods. • This avoids what in the accounting field is known as “double counting.” LO1
Value Added in Various Stages of Production • (Pg. 91) LO1
Value Added • Intermediate goods: • goods or services purchased for use as inputs in the production of final goods or services. • Value added: • the increase in the market value of a product that takes place at each stage of the production process. LO1
Two Ways to Calculate GDP 1. Compute the value of the final output. 2. Count only the value added at each stage of production. LO2
Value added Stages of Production Transaction Value Value Added 1. Logger produces logs for the sawmill: $500 $500 2. Sawmill produces lumber for the furniture factory: $1,200 $700 3. Furniture factory produces furniture for the Store: $5,000 $3,800 4. Store sells furniture to the Public: $7,500 $2,500 Total Value of Transactions: $14,200 $7,500
Computing Real GDP • Inflation: • the increase in the average level of prices of goods and services. • Inflation distorts comparisons of GDP over time. • Nominal vs. Real GDP - • accounting for inflation.
Computing Real GDP • A base period is picked to be the time period used for comparative analysis. • It is the basis for the indexing of price changes.
Computing Real GDP (2005 prices) • The general formula for computing real GDP is:
Computing Real GDP • (Pg. 92) Base year Index value = 103.3
Nominal to Real GDP Nominal GDP (Billions $) Year 312 397 452 521 537 596 676 719 814 1997 1998 1999 2000 2001 2002 2003 2004 2005 Nom. Change (Billions $) 85 55 69 16 59 80 43 95 GDP Deflator 89 92 96 100 101 104 111 118 126 Real GDP (Billions $) 351 432 470 521 531 573 609 609 646 Real Change (Billions $) 81 38 51 10 42 36 0 37
Chain-Weighted Price Adjustments • Chain-weighted indices use a moving average of price levels in consecutive years as an inflation adjustment. • You won’t be tested on chain-weighted indices. LO3
Net Domestic Product (NDP) • Now let’s make an ADJUSTMENT to GDP: LO3
Net Domestic Product (NDP) • Example situation: You produce You’ve got – $1,000 ↑ Wore out Produced→ $10,000 (GDP) LO3
Net Domestic Product (NDP) • We can’t produce as much output next year unless… … we replacethe capital we use-up this year. • Depreciation: - the consumption of capital in the production process. (the wearing out of plant and equipment). LO3
Net Domestic Product (NDP) Depreciation Depreciation GDP GDP NDP Depreciation Depreciation New Capital Stock Old Capital Stock
Net Domestic Product (NDP) • Net Domestic Productis what we’ve produced (GDP), minus the capital we’ve worn out (depreciation). • The amount of output we (C+G) could consume without reducing our stock of capital. NDP = GDP – depreciation LO3
Net Domestic Product Depreciation Depreciation GDP GDP NDP Depreciation Depreciation Capital Stock Old Capital Stock
Gross vs.Net Investment • Investment: • production of new plant, equipment, and structures (capital),… …plus changes inbusiness inventories, …and new residential construction. LO3
Gross vs.Net Investment • The difference between GDP and NDP is mirroredby the difference between gross investment and net investment: • Gross investment: - total investment expenditure in a given time period. • Net investment: = gross investment – depreciation LO3
NetInvestment Total capital stock has increased Dep. Gross Investment I G Depreciation The change in our capital stock GDP (positive) NDP Net Investment Gross Investment C Gross Investment Depreciation New Capital Stock Old Capital Stock
NetInvestment Gross Inv. Depreciation Total capital stock has decreased Gross Investment I G G GDP NDP Net Investment C C Depreciation Depreciation Depreciation (negative) Gross Inv. Capital Stock
2. The Uses of Output ( Re: C+I+G+(X-M) )
The Uses of Output • The 4 major uses of total output parallel the four sets of market participants: • Households – consumption (C) = 70% • Business Firms – investment (I) = 17% • Government – gov’t spending (G) = 20% • Foreigners - net exports (X-M) = –7%
Measures of Income • GDP accounts have two sides. • Expenditures – the demand side. • Income – the supply side. LO2
Measures of Income Income = Output …so… Income = GDP • By charting the flow of income through the economy, we see FOR WHOM our output is produced. LO2
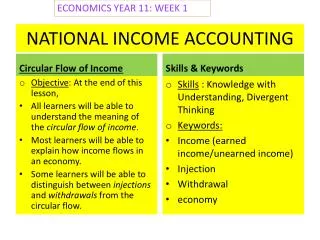
The Circular Flow (pg. 44) Business Firms Product markets Factor markets Consumers Goods and services demanded Goods and services supplied Factors of production supplied Factors of production demanded