Microarray Evaluation for Gene Regulation Analysis: Methodologies & Insights from PDGF Studies
This presentation by Dr. Martin Seifert from Genomatix Software GmbH explores the methodologies employed in microarray analysis, including the evaluation of metabolic pathways, regulatory networks, and their relevance to disease mechanisms. The discussion focuses on statistical analysis and clustering techniques, with case studies, such as the role of PDGF in fibroblasts. The analysis integrates literature mining, genomic sequence analysis, and exploratory data evaluation, providing a comprehensive overview of how microarray data can be leveraged to uncover biological functionalities.


Microarray Evaluation for Gene Regulation Analysis: Methodologies & Insights from PDGF Studies
E N D
Presentation Transcript
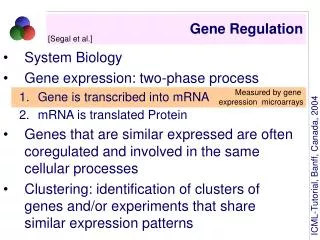
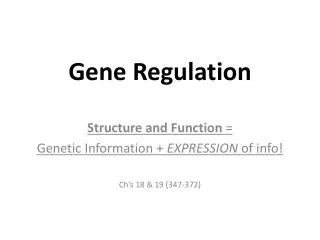
Microarray Evaluation for Gene Regulation Analysis Dr. Martin Seifert Genomatix Software GmbH Landsberger Strasse 6, D-80339 München http://www.genomatix.de
The general goal in microarray analysis Metabolic pathways Regulatory networks Classification / Diagnostics Disease mechanisms Biological functionality is not directly evident from microarrays Microarrays today ? Microarray experiment Cell
How to reach the general goal in microarray analysis? Genomatix knowledge transfer approach Methods for microarray data analysis Literature analysis Statistic analysis Cellular processes Sequence analysis (Genome annotation and promoter analysis)
PDGF Intro Evaluation of the role of PDGF in fibroblasts Statistical analysis; clustering PDGF stimulation of fibroblasts (Demoulin et al. JBC 279, No. 34, 2004; 35392–35402) Microarray experiment Evaluation of chip clusters Chip data Cluster PDGF Genomatix What is the biological functionality behind the chip data? A real life example
Linking genomic sequence analysis and literature mining Technology Analysis of promoter sequences/ database scans Promoter source for functional promoter analysis Automatic evaluation of gene relationships
Analysis Strategy Workflow of the project 2 Project statistical clusters onto biology and categorization of results by z-scoring (BiblioSphere) 1 Find statistical clusters 4 Carry out additional statistical analysis 5 Merge results into biological context 3 Analyze functional groups for co-regulation (ElDorado & GEMS) and find additional potentially co-regulated genes (ModelInspector) Analysis strategy
Step 1: Statistical Analysis Methods for microarray data analysis Literature analysis Statistic analysis Cellular processes Sequence analysis
Statistical analyzed microarray data data 1 4 10 24 Significance Analysis for Microarrays (SAM; FDR: 4,3%) 105 of 9928 gene spots are significantly up regulated (Chip: Hver1.2.1) Cluster Analysis hours PDGF induction
Biology 1 subtitle 2 Project statistical clusters onto biologyand categorization of results by z-scoring (BiblioSphere) Workflow Literature analysis Statistic analysis Cellular processes Sequence analysis
Characterisation of experimental cluster with BiblioSphere cluster contains 107 genes Too many genes for biological meaningful co-regulation Strategy: knowledge driven sub-clustering Find functional correlations Functional correlations are retrieved by categorization Gene Cluster BiblioSphere: Large Cluster Query
Ontology based functional ranking: Genomatix z-scoring Knowlege driven sub-clustering highest z-score
Ontology based functional ranking: Genomatix z-scoring retrieval of genes overrepresented in the GO-category sterol biosynthesis Knowlege driven sub-clustering
BiblioSphere subgroup analysis: connecting TFs re-enter the six overrepresentd genes into BiblioSphere Gene group analysis
Towards regulatory networks: connecting TFs Co-citation for HMGCS1, HMGCR, SC4MOL, DHCR7 with SREBF1 Prediction of SREBF1 (EBOX) binding sites in the promoters of HMGCS1, HMGCR and DHCR7 ElDorado Knowlege driven sub-clustering Bibliosphere on sentence level; at least 4 co-citations with input genes
SREBP1 (=SREBF1) expression is experimentally confirmed Experimental verification
Genomics subtitle 3 Analyze functional groups for co-regulation (Gene2promoter & GEMS) and find additional potentially co-regulated genes (ModelInspector) Workflow Literature analysis Statistic analysis Cellular processes Sequence analysis
Promoter analysisby GEMS based on ElDorado data Promoter analysis ElDorado + Gene2Promoter GEMS Results from literature analysis are used to guide sequence analysis Sequence analysis Literature analysis
Analysis strategies: Inter-genomic and intra-genomic DHCR24 DHCR7 EBP HMGCR HMGCS1 SC4MOL human mouse rat 6 genes sterol synthesis 107 genes Sequence analysis Comparative analysis of promoters within one species -> co-regulation Comparative genomics of promoters -> phylogenetic conservation
Comparative promoter analysis (intra-genomic co-regulation) Extraction of the promoters of DHCR24, DHCR7, EBP, HMGCR, HMGCS1, and SC4MOL Analysis of the promoters of DHCR24, DHCR7, EBP, HMGCR, HMGCS1, and SC4MOL with FrameWorker ElDorado + Gene2Promoter GEMS Frameworks underly functional conservation of promoters Intra-genomic approach
Promoter resourceElDorado / Gene2Promoter promoter ElDorado Alternative promoters/ transcripts Regulatory SNPs Regulatory regions Promoter modules Interconnected to: BiblioSphere GEMS Regulatory genome annotation
Promoter retrievalElDorado / Gene2Promoter Regulatory genome annotation
Promoter retrievalElDorado / Gene2Promoter Regulatory genome annotation
Promoter retrievalElDorado / Gene2Promoter Regulatory genome annotation
Promoter analysis withFrameWorker Analysis of promoter organization
EBOX (SREBF1) frameworks are found in a subset of the genes EBOX ECAT ZBPF Frameworks are conserved in order and distance of TFBSs Analysis of promoter organization Genes sharing framework: DHCR7, EBP, HMGCS1
EBOX (SREBF1) frameworks are found in a subset of the genes EBOX ECAT ZBPF EBOX ECAT ZBPF EBOX ECAT ZBPF Analysis of promoter organization
ModelInspector search EBOX ECAT ZBPF Genomatix Human promoter databaseGPD Beyond the microarray framework
ModelInspector results highly selective model no Additional found genes for steroid metabolism so fare... The selectivity is reduced by modification of the model by increasing of the distance variability (application of FastM) Results of database search
modification of the model with FastM distance variability is increased to 5-100 bp Model modification
additional ModelInspector search EBOX ECAT ZBPF Genomatix Human promoter databaseGPD Beyond the microarray framework with modified distance variability
ModelInspector results Additional found genes related to steroid metabolism: LSS, MVK, SC5DL, SREBF2 LSS and MVK are present on chip, up-regulated but not statistically significant SC5DL, is not present on microarray Possibility to re-evaluate statistical results Results of database search
Additional framework analysis All sterol-metabolism related genes identified by microarray analysis, and Modelinspector are included: HMGCS1, MVK, SC5DL, DHCR7, EBP, SREBF2, LSS, HMGCR, SC4MOL, DHCR24 A additional framework consisting of three TFBSs found It matches 8 of 10 genes input genes: HMGCS1, DHCR7, HMGCR, EBP, LSS; MVK, SC5DL, SREBF2 ECAT EGRF ZBPF Re-analysis of promoter organization
Is the framework also part of other human Promoters? ECAT EGRF ZBPF Genomatix Human promoter databaseGPD Matches may overlap with first framework but are basically distinct Second framework is searched in human promoters by ModelInspector Several frameworks may be important for sterol-related pathways/networks Beyond the microarray
ModelInspector results CYP46A1, FDPS, HMGCR, HSD17B8, OPRS1, SREBF1!, STARD5 SREBF1/2 are potential regulators of the previous framework! SREBF1/2 may be mediators between the two frameworks identified so far Results of second database search
Statistics2 subtitle 4 Carry out additional statistical analysis Workflow Literature analysis Statistic analysis Cellular processes Sequence analysis
Clustering by profile of the initially selected 105 genes Profile cluster Initial profile Expression cluster is extended by Pavlidid Template Matching (PTM) Cluster of 105 significant regulated genes is taken as template The threshold p-value is 0.1 Cluster is extended to 798 genes (including all 105 initial genes) Relaxed statistics requires cross-validation by second evidence Relaxed statistical approach
Biology 2 subtitle 5 Merge results into biological context Workflow Literature analysis Statistic analysis Cellular processes Sequence analysis
Comparison of ModelInspector results with profile cluster 52 genes share a common framework and are co-expressed 8 genes belong to the GO-category "steroid biosynthesis": DHCR24, DHCR7, EBP, HMGCR, HMGCS1, LSS, MVK, SC4MOL • Eight genes are associated with steroid metabolism are supported by three lines • of evidence: • Common up-regulation • Common framework • Common functional class (GO-annotation) Merging profile and database searches
Sterol biosynthesis and regulatory networks EBOX ECAT ZBPF ECAT EGRF ZBPF
Confirmation of results by GNF tissue profiles Example: profile of HMGCS1 Find correlates with cut-off 0.6
Sterol biosynthesis and regulatory networks EBOX ECAT ZBPF ECAT EGRF ZBPF GNF profile
Additional gene group: Tubulins CDEF EGRF MAZF
Sterol biosynthesis / cell structure proteins and regulatory networks CDEF EGRF MAZF EBOX ECAT ZBPF ECAT EGRF ZBPF
PDGF conclusions Evaluation of microarray data However, the final focus usually is on a few genes (30 or less usually) No individual method can reveal networks and pathway mechanisms An alternating combinatorial approach can achieve this Several independent functional groups may be derived from one chip All of this is possible based on available tools Genomatix technology elucidates the biology behind the chip data! Conclusions