Download
1 / 61
610 likes | 754 Views
Racial, Ethnic and Socioeconomic Health Disparities in the US. Richard Lichtenstein Ph.D., MPH University of Michigan School of Public Health June, 2010. Why is the health status of African Americans worse than the health status of Caucasian Americans?. Health Status is a Function of:.

E N D
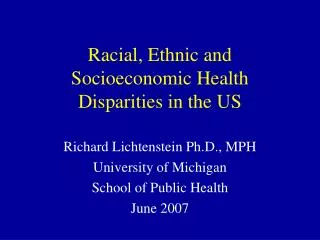
Racial, Ethnic and Socioeconomic Health Disparities in the US Richard Lichtenstein Ph.D., MPH University of Michigan School of Public Health June, 2010
Why is the health status of African Americans worse than the health status of Caucasian Americans?
Health Status is a Function of: • Biology/Genetics • Lifestyle/Behavior • Social/Societal Characteristics • Physical Environment (“Total Ecology”) • Medical Care Tarlov, A.R. “Public Policy Frameworks for Improving Population Health.” Annals of the New York Academy of Sciences 896:281-293 (1999)
Impact of Various Domains on Early Deaths in a Population Source McGinnis, et al, Health Affairs 21: 78. March/April 2002
A major area of research on Health Disparities today is called:THE SOCIAL DETERMINANTS OF HEALTH (SDOH)
GENERAL MODEL OF SOCIAL DETERMINANTS SocialFactors Personal Factors Outcomes Access to Services Individual risk factors Disease Quality of living area Stress Adoption of Preventive Behavior Health Discrimination Self Regulation/ Management Social Support Fundamental Factors: Money, Power, Prestige CUES, NYAM, 2000
Diagram by Whitehead M and Dahlgren C, in “What can be done about inequities and health?”, The Lancet, 338, 8774, 26 October 1991, 1059-1063.
Poverty is the Major Factor in Health Disparities Which Racial or Ethnic Group Accounts for the Most People in Poverty in the US?
Number ofPersons Below Poverty Level By Race, 2007 In Thousands Source: Health, United States, 2009, Table 3
Percent ofPersons Below Poverty Level By Race, 2007 Percent below poverty Source: Health, United States, 2009, Table 3
Why is there a relationship between socioeconomic status and race?
What is Race? • Race is not a biological determinant • “Race is a social construct, a social classification based on phenotype, that governs the distribution of risks and opportunities in our race-conscious society.” Camara Phyllis Jones, Am J Epidemiol, 154: 299-304 (2001)
What is Race? • “Although ethnicity reflects cultural heritage, race measures a societally imposed identity and consequent exposure to the societal constraints associated with that particular identity.” Camara Phyllis Jones
Race Varies by Country • “This assigned race varies among countries…In the United States I am clearly labeled Black, while in Brazil I would be just as clearly labeled White and in South Africa I would be clearly labeled "colored." It is likely that, if I stayed long enough in any one of these settings, my health profile would become that of the group to which I had been assigned, even though I would have the same genetic endowment in all three settings.” Camara Phyllis Jones
Beware of treating Race and Ethnicity as Monolithic Concepts • Is everyone who is black poor? • Do all Latino sub-groups experience the same degree of unequal health compared to whites?
Health Disparities or Health Inequalities are inequities that are related to differences in health status or medical treatment that are unfair to disadvantaged people and that are avoidable Braverman and Tarimo, Soc Sci and Med:54:1621-1635 (2002).
“Pursuing equity in health care means striving to reduce avoidable disparities in physical and psychological well-being—and in the determinants of that well-being—that are systematically observed between groups of people with different levels of underlying social privilege, i.e., wealth, power or prestige.” Braverman and Tarimo, Soc Sci and Med:54:1621-1635 (2002).
Demographic and Health Characteristics of People on the Eastside of Detroit
Table 1: Socio-Demographic Characteristics of Eastside and Central Detroit in Comparison to City of Detroit and the National Average Source: 1U.S. Bureau of the Census, 2006-2008 American Community Survey 3-Year Estimates 2Detroit data from www.CHIMart.org, 1999-2001 data
Table II: Health Status Characteristics of the Eastside in Comparison to the City of Detroit and the U.S. Population Detroit data from www.CHIMart.org, 1999-2001 data *2006 Data from Health, United States, 2009 Table 26 **Infant deaths/1000 live births, Health, United States, 2009, Table 19
Life Expectancy at Birth by Race and Sex, 1970-2006 Source: Health, United States, 2009, Table 24
Age-Adjusted Death RatesDue to All Causes, by Race and Hispanic Origin, 2006 Source: Health, United States, 2009, Table 25
Age-adjusted Death Rates by Race, 2006 Source: Health, United States, 2009, Table 26
Native American Death Rates Compared to All Races New York Times, December 2, 2009
Years of Potential Life Lostdue to Ischemic Heart Disease,by race and Hispanic origin, 2006 * Age-adjusted years lost before age 75 per 100,000 population under 75 years of age. Source: Health, United States, 2009, Table 27
Years of Potential Life Lostdue to Diabetes Mellitus,by race and Hispanic origin, 2006 * Age-adjusted years lost before age 75 per 100,000 population under 75 years of age. Source: Health, United States, 2009, Table 27
Years of Potential Life Lostdue to Homicide,by race and Hispanic origin, 2006 * Age-adjusted years lost before age 75 per 100,000 population under 75 years of age. Source: Health, United States, 2009, Table 27
5 Year Relative Survival Rates for Breast Cancer White Female Percent of Patients (%) Black Female Source: Health, United States, 2009, Table 50
Infant Mortality Rates by Race*United States, 1970-2006 Deaths per 1,000 Live Births Source: Health, United States, 2009, Table 19 *Race of mother
Infant mortality rates by detailed race and Hispanic origin of mother: United States, 2005 White, not Hispanic Black, not Hispanic Hispanic (total) Puerto Rican Other Hispanic Mexican Central and South American Cuban Asian or Pacific Islander (total) American Indian or Alaska Native Infant per 1,000 live births NOTES: Infant is defined as under 1 year of age. Persons of Hispanic origin may be of any race. The race groups, Asian or Pacific Islander and American Indian or Alaska Native, include persons of Hispanic and non-Hispanic origin. See Data Table for data points graphed and additional notes. Centers for Disease Control and Prevention, National Center for Health Statistics. Health, United States, 2009
Infant Mortality Rate by Race (of mother), 2001-2006 IMR: Deaths of infants under 1 year per 1,000 live births Source: Health, United States, 2009, Table 19
International Rankings for Infant Mortality1960 and 2006 Source: Health, United States, 2009, Table 22
IMR - International Rankings 2009 Source: CIA – The World Factbook: (accessed May 14, 2010)
Infant Mortality Rates by mother’s education, race, and Hispanic origin, 2003-2005 Source: Health, United States, 2008, Table 19
Low Birth Weight* by Race and Ancestry of Mother, 2007 *less than 2500 grams Source: Division for Vital Records and Health Statistics, Michigan Department of Community Health, 2007
Activities of Daily Living (ADL) and Instrumental ADL (2008) Source: National Health Interview Survey, 2008
Percent with Fair or Poor Self-Rated Health Status, 2007 Percent Source: Health, United States, 2009, Table 57
Fair or Poor Health among Adults18 years and older by family income, race, and Hispanic origin, 2007 Source: Health, United States, 2009, Table 57
For Want of a Dentist Pr. George's Boy Dies After Bacteria From Tooth Spread to Brain By Mary Otto Washington Post Staff WriterWednesday, February 28, 2007; Page B01 Twelve-year-old Deamonte Driver died of a toothache Sunday. A routine, $80 tooth extraction might have saved him. If his mother had been insured. If his family had not lost its Medicaid. If Medicaid dentists weren't so hard to find. If his mother hadn't been focused on getting a dentist for his brother, who had six rotted teeth. Deamonte's death and the ultimate cost of his care, which could total more than $250,000, underscore an often-overlooked concern in the debate over universal health coverage: dental care.
Utilization of ServicesHealth Insurance is important to Access, but it is not the only factor
No Health Insurance Coverage among persons under 65, by race and Hispanic origin, 2004 Source: Health, United States, 2006, Table 135.
Percent of Children under 18 with No Usual Source of Care by Insurance Type, 2006-2007 Source: Health United States, 2009, Table 75
Vaccinations among Children 19-35 months old by Poverty Status and Race, 2007 Source: Health, United States, 2009, Table 82
Proportion of Live Births with Late* or No Prenatal Care, by Race and Ethnicity of Mother, 2006 *third trimester Source: Health, United States, 2009, Table 7 (37 states, DC and NYC)
Children under 6 with no physician contactswithin last year, by race, and Hispanic origin, and poverty status, 2005-2006 AVERAGE all children under 6 without a health care visit in 2005-6 – 6.1% * Estimates are for 2004/2005 (data not available for 2005-2006) Source: Health, United States, 2008, Table 82