Download
1 / 27
280 likes | 672 Views
USING BIOMARKERS FOR EARLY PHASE DOSE SELECTION WITH PROTEIN ANTAGONIST DRUGS. Ivan Nestorov ivan.nestorov@biogenidec.com. TALK FRAMEWORK. Setting the stage: introductions and definitions PK and binding as major early markers Biological activity as validation for binding Walk-through example

E N D
USING BIOMARKERSFOREARLY PHASE DOSE SELECTIONWITHPROTEIN ANTAGONIST DRUGS Ivan Nestorovivan.nestorov@biogenidec.com
TALK FRAMEWORK • Setting the stage: introductions and definitions • PK and binding as major early markers • Biological activity as validation for binding • Walk-through example • Regulatory implications
THERAPEUTIC PROTEINSafter B.M. Rao, D.A. Laufenburger, K.D. Wittrup. Integrating cell-level kinetic modeling into the design of engineered protein therapeutics. Nature Biotechnology. 23: 191-194, 2005. • Antagonists (e.g. antibodies, soluble receptors) - block native protein interactions by binding to target protein(s) • Examples – anti-TNF, anti-VEGF, anti-BLyS/APRIL • Agonists (e.g. cytokines, growth factors) - stimulate cell surface receptors • Examples – erythropoietin, rhGH, G-CSF, IL-2 • Targeting agents (e.g. antibodies, immunotoxins) – target specific cell surface antigens or deliver therapeutic agents • Examples – anti-CD20
EXAMPLES:BLYS/APRIL antagonist (atacicept) • B cell differentiation • B cell survival • Antibody production • Ig class switch BLyS (BAFF) APRIL BAFF-R Heterotrimer BCMA B-Cell TACI
THE RESPONSE CASCADEM Danhof, G Alvan, SG Dahl, J Kuhlmann, G Paintaud. Mechanism-based pharmacokinetic-pharmacodynamic modeling-a new classification of biomarkers. Pharm Res. 2005; 22:1432-1437. PHASE 1 DATA HOW TO USE THIS INFORMATION FOR DOSAGE REGIMEN DESIGN IN PHASE 2/3?
Atacicept exposure–response cascade (RA) FREE DRUG FREE TARGET COMPLEX IgX FACS IgX RF ACPA ESR, CRP JOINT CNTS ACRXX% DAS28 DOSE & Freq. BLyS/APRIL Inhibition MoA Biomarkers Disease Biomarkers Clinical Markers Clinical Endpoints Binding & Inhibition Biological activity Disease related activity Clinical activity Clinical efficacy
THERAPEUTIC PROTEINS • Large molecules, slow PK and PD • Specific binding to targets dominant (by engineering) • Target load often: • Significant (in molar concentration terms) • Distributed across various tissues • Constantly renewed by endogenous production of targets • Endogenous production may be boosted by depletion • Nonspecific binding sometimes negligible (!!! check) • No P450 metabolism, but Ab’s to drug possible • Protein drug metabolism often capacity limited
PK & TARGET BINDING: MAJOR EARLY MARKERS • Free drug PK is expected to be nonlinear • Unless nonlinearity is overwhelmed • Or unless total drug is measured • PK Assays are critical • Dosing should be targeted at the saturation • Below saturation – sub-therapeutic regimen • Above saturation – waste of drug and/or potential over-inhibition • Saturation – both in blood and tissues • Saturation is a dynamic process – at all times
TISSUES, SoA L2 KINETICS FREE DRUG PK ABSORPTION SITE BLOOD BLOOD BINDING TO L1 & L2 TISSUES, SoA TISSUES, SoA L1 KINETICS BLOOD endogenous production PK & BINDING BINDING EQUILIBRIUM: • Binding affinity • Drug & ligand concentrations • Systemically • In tissues • Dosing schedule • Endogenous ligand production • Systemically • In tissues
TISSUES, SoA L2 KINETICS FREE DRUG PK ABSORPTION SITE BLOOD BLOOD BINDING TO L1 & L2 TISSUES, SoA TISSUES, SoA L1 KINETICS BLOOD endogenous production PK, BINDING & DOSING OBJECTIVE: • Adequate binding • Process in time • At Sites of Action • Not necessarily complete binding of ligand • Markers of PK/binding • Free drug • Total drug • Complex concentration • Free ligand concentration • Means to achieve goal: • Type of dosing regimen • Dosing levels • Dosing frequency • Mode of administration
ACCUMULATION OF COMPLEXP.P. Tak, et al. Atacicept in patients with rheumatoid arthritis: an exploratory, multicenter, double-blind, placebo-controlled, dose – escalating, single and repeat dose phase 1b study. Accepted Arthr. & Rheum. ar-06-1723, 2007.
BLyS Concentration after Rituximab in RAG. Cambridge et al. Circulating Levels of B Lymphocyte Stimulator in Patients With Rheumatoid Arthritis Following Rituximab Treatment. Arthritis and Rheumatism 54: 723-732 (2006). BLyS accummulation rate in serum: ~0.08 ng/mL/day
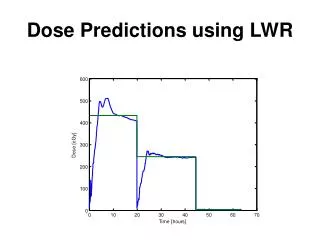
DESIGN SO FAR: • Type of dosage: Loading - Maintenance • Eliminate initial target ligand load • Boost the redistribution of target ligand • Compensate endogenous ligand production • Dose levels and dosing frequency ??? • Mode of administration: ???
RECEPTOR MEDIATED PKA. Munafo, A. Priestley, I. Nestorov, J. Visich, M. Rogge. Safety, pharmacokinetics and pharmacodynamics of atacicept in healthy volunteers. Eur. J. Clin. Pharm. 63:647-656 (2007). Atacicept/BLyS Complex Free Atacicept
QUIZ:DOSING FREQUENCY? Terminal Halflife: 20-30 days
QUIZ:DOSING FREQUENCY? 30-40% incomplete inhibition Next dose?
Biological activity tracks target ligandbinding More frequent dosing at smaller doses yields better effect Biological Activity Drug-Ligand Complex
DESIGN SO FAR: • Biological activity tracks binding • Type of dosage: Loading - Maintenance • Eliminate initial ligand load • Boost the redistribution of ligand • Compensate endogenous ligand production • Dose levels and dosing frequency • More frequent smaller doses yield higher biological activity compared to less frequent higher doses • Single dose saturation – between 75 and 210 mg • Dosing interval to maximize inhibition – 7 – 14 days • What doses / dosing intervals??? • Mode of administration: ???
S.C. injection S.C. ADMINISTRATION of PROTEIN DRUGS • Uptake by lymphatic system • Poorly quantified • Dependent on MW • Lymphatic & blood circulation closely interwined • Consider kinetic vs dynamic rates • Lymph can be SoA
COMPARING S.C. & I.V. ADMINISTRATION … but biological activity is the same … S.c. Atacicept systemic bioavailability is ~ 35 - 40% …
COMPARING S.C. & I.V. ADMINISTRATION … because target binding is the same!
DESIGN SO FAR: • Biological activity tracks binding • Type of dosage: Loading - Maintenance • Eliminate initial ligand load • Boost the redistribution of ligand • Compensate endogenous ligand production • Dose levels and dosing frequency • More frequent smaller doses yield higher biological activity compared to less frequent higher doses • Single dose saturation – between 75 and 210 mg • Dosing interval to maximize inhibition – 7 – 14 days • What doses / dosing intervals??? • Mode of administration: SC
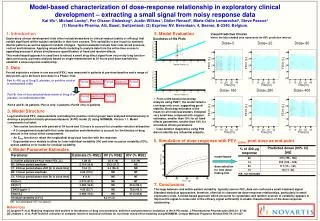
DOSE CL Ka Q Abs. Site Central Peripheral Vc Vp IgM, IgG, IgA TIME TO BECOME QUANTITATIVE… ATACICEPT Pop PK/PD MODEL I. Nestorov et al. Population modeling of the relationship between TACI‑Ig exposure and biomarker response in patients with rheumatoid arthritis (RA). Population Analysis Group in Europe meeting PAGE 2006, June 14-16, 2006.
Simulations: Dose saturation of effect Varying doses, same dosing frequency (QW) IgM [% of baseline] Going beyond 150 mg for QW not justified
DESIGN COMPLETE • Biological activity tracks binding • Type of dosage: Loading - Maintenance • Eliminate initial ligand load • Boost the redistribution of ligand • Compensate endogenous ligand production • Dose levels and dosing frequency • More frequent smaller doses yield higher biological activity compared to less frequent higher doses • Single dose saturation – between 75 and 210 mg • Dosing interval to maximize inhibition – 7 – 14 days • Dosing frequency – once weekly (QW) • Dose levels for Phase 2/3 study: 25, 75 and 150 mg • Mode of administration: SC
REGULATORY ACTION PHASE 1
CONCLUSIONS • PK and target binding are major early biomarkers for protein antagonists • Saturation of binding can be used for early phase dosage regimen design • Population PK/PD modeling helps quantify saturation • Mechanistic validation should be implemented as much as possible