Download
1 / 37
370 likes | 465 Views
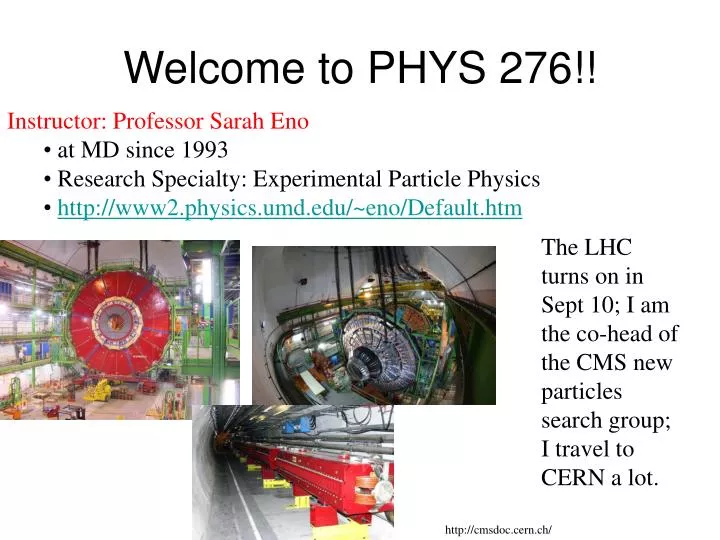
Welcome to PHYS 276!!. Instructor: Professor Sarah Eno at MD since 1993 Research Specialty: Experimental Particle Physics http://www2.physics.umd.edu/~eno/Default.htm. The LHC turns on in Sept 10; I am the co-head of the CMS new particles search group; I travel to CERN a lot.

E N D
Welcome to PHYS 276!! • Instructor: Professor Sarah Eno • at MD since 1993 • Research Specialty: Experimental Particle Physics • http://www2.physics.umd.edu/~eno/Default.htm The LHC turns on in Sept 10; I am the co-head of the CMS new particles search group; I travel to CERN a lot. http://cmsdoc.cern.ch/
TA TA Introduction: Mr Li and Mr. Cole.
Introductions Name, class, major?
Goals for this Course • Learn experimental techniques and equipment for studying electricity and magnetism • Reinforce understanding of E&M and electronics gained last semester in lecture course through hands-on experience • Learn importance of proper recording keeping and scientific writing for experimental science: learn how to write a lab report • Further develop skills in error analysis, beyond that gained in 174, 275 Class web page: http://www2.physics.umd.edu/~eno/teaching/276/f08/f08.htm
Schedule See handout Some oddness comes from my travel requirements
Syllabus Our contract: let’s go through it.
Blackboard Will use to turn in our in-class spreadsheets and our Lab reports. Will try it out at the end of this class, after we do a little refresher exercise
Goals • Learn experimental techniques and equipment for studying electricity and magnetism • Reinforce understanding of E&M and electronics gained from lecture course through hands-on experience
Lab 0 • NEWish! • review error analysis and oscilloscope No lab report, just excel spreadsheet
Lab 1 • Electric Circuit Basics: NEW! May need some debugging. Use handout, not lab in book. • Remember what current, voltage, resistance are. • Remember the basic symbols used for common circuit elements • Measure the internal resistance of a battery • learn how to take into account imperfections in meters when doing data analysis • practice doing linear fits
Lab 2 • Magnetic Fields due to Currents • Remember the Biot and Savart law and Ampere’s Law • learn how to use a Hall probe to measure magnetic fields • remember the field due to a current loop, a coil, and a toroid
Lab 3 • Force on charged particle due to electromagnetic fields • Remember the Lorentz Force • use an electron gun • learn how to take into account the earth’s magnetic field when doing magnetic experiments Will not do!
Lab 4 • RC and RL circuits driven by a step-function voltage source • remember what capacitance and inductance are • remember what the time constant is for circuits containing RC and RL elements • use WAVESTAR to transfer data from an oscilloscope to a computer No lab report, just excel spreadsheet
Lab 5 • RC Circuits driven by a sine wave voltage generator, part I • Remember “AC” circuits • Remember about phases in AC circuits
Lab 6 • RC Circuits driven by a sine wave voltage generator, part II • Observe resonance in an LRC circuit • LRC circuits driven by a square wave voltage generator
Lab 7 • Diode and Rectifier Circuits • more on diodes • building a crude AC to DC converter No lab report, just excel spreadsheet
Lab 8 • New lab on transistor • Learn about transistor and help us debug the lab. No lab report, just excel spreadsheet
Goals • learn importance of proper recording keeping and scientific writing for experimental science: learn how to write a lab report
A Dzero Note http://www2.physics.umd.edu/~eno/teaching/276/f08/lectures/example_modern_lab_report.pdf
Lab Reports See pg 3 of lab manual and “rubric” on class web page Figures from lab manual available on class web page. Will do 4 reports this semester
Goals • further develop skills in error analysis, beyond that gained in 174, 275 Introduction to Error Analysis, J. Taylor, Unversity Science Books, 1997 Use it!
Estimating Errors: Review • Systematic errors : sources of error that have the same size effect on every measurement that is made (or a correlated effect) • a ruler that was not manufactured correctly • a consistently delayed reaction when using a stop watch • your inability to perfectly estimate the size of a stray magnetic field from your computer that leaks into your experimental area • Random errors: sources of error whose effect varies with each measurement • precision of your measuring device • when using a stop watch, a reaction time that sometimes anticipates the event, some times is in retard of the event.
Systematic Errors Usually estimated using information from the manufacturer of the measuring device or by making measurements of a calibrated standard. “Mistakes” are not systematic errors. They are mistakes. Do not use data that has known mistakes, if the data can not be reliably corrected for the mistake. If you have made a mistake, you need to correct the data or retake the data. For example, failing to take into account the resistance of your ammeter when testing ohm’s law is a mistake, not a systematic error. Uncertainties on its resistance, because your ability to measure its value is limited, do lead to a systematic error. Systematic errors instead come from your limits on your ability to asses the accuracy of the device, even when it is being used correctly.
Random Errors Usually distributed according to a Gaussian Distribution 68% of data within 1 “sigma” 95% within 2 “sigma” (s) What were some random errors from 174? How did we estimate them?
Error Propagation: Review You have taken a measurement, which has an error (uncertainty), and want to use it in a calculation. What is the uncertainty on the result of the calculation due to the uncertainty on the measurement?
Error Propogation: Example Length of a table is 2 m +- 0.01 m Width is 1 m +- 0.005 m What is the area? What is the error on the area?
Error Propagation: Example You take 3 independent measurements of the period of a pendulum. You get 15+-0.1s, 14.8+-0.1s, and 14.9+-0.1s. What is the average of these 3 measurements?
Error Propagation: Try it Calculate this in EXCEL. You will submit your work at the end of class. We’ll move on when all of you are done. You drop a ball (initially at rest) and it falls 3 m +- 0.01 m in 0.785+-0.002 s. What is g? Strongly suggest you put each number in a separate cell, the formula for each partial derivative in a cell, and then multiply, square and add them up. It makes it easier to spot errors!
Review: Chi2 You’ve made a measurement and want to compare it to theory. How do you do this? How far is the data from the theory in natural units (size of the error)? If the data is in good agreement with the theory, what should the value of chi^2 be? Degrees of freedom: number of data points – number of parameters in the theory that are determined using the data Reduced chi2: chi2/ndof
Review: Chi2 Estimating the chi2 for this data to the theory curve by eye (no fitting parameters). Put the result in your spreadsheet.
Review: Chi2 Using this table, find the probability that the graph on the previous slide would have a chi^2 that big or bigger from random errors alone. Put the result in your spreadsheet.
What to do if your chi^2 turns out to be too low or too high? What is too low or too high? What could the causes be? What to do in your lab report
Fitting: Review Have some data points. What straight line curve best “fits” the data? -> what values of m and b minimize the chi^2 between the line and the data. “perfect fit” z would be zero. Theory is that z is zero. Have 2 fitting parameters. m and b. Measurements are x and y z=y-(mx+b)
Practice linear fitting Make a plot of this data including error bars.
Practice: Linear Fit Use fred’s template to fit this data. Calculate the chi^2 and calculate the probability to get a chi2 this big or bigger due to random errors. Can go when get right answer. (for discussion on an alternative way to understand this fitting procedure, and how to get the errors on the slope, intercept, see Taylor, chapter 8)
Oscilloscope Oscilloscope review
Next week See you next week!