Download
1 / 21
210 likes | 355 Views
Leveraging Virtualization at HUD. Office of the Chief Information Officer. OurHUD, OurTrends. HUD Business Overview. HUD IT Portfolio Distribution. Invests approximately $300M annually in IT Increased Home Ownership Promote Decent Affordable Housing Strengthen Communities

E N D
Office of the Chief Information Officer OurHUD, OurTrends
HUD Business Overview HUD IT Portfolio Distribution • Invests approximately $300M annually in IT • Increased Home Ownership • Promote Decent Affordable Housing • Strengthen Communities • Ensure Equal Opportunities in Housing • Embrace High Standards of Ethics • Enhance Management and Accountability • Promote Participation of Community-Faith Based Organizations $400M $300M New Development Staff $200M Development Maintenance $100M Infrastructure FY-03 FY-04 FY-05 FY-06 $389M $366M $336M $279M Secretary of Housing & Urban Development HUD’s MISSION Public & Indian Housing Fair Housing & Equal Opportunity Healthy Homes & Lead Hazard Control Faith-Based & Community Initiatives Increase homeownership, support community development, and increase access to affordable housing free from discrimination. Federal Housing Commissioner Community Planning & Development Policy Development & Research Government National Mortgage Assoc.
HUD’s Leadership in Infrastructure Transformation The need for business speed means … … IT must change. Agility of Response: Respond Faster IT has unpredictable reliability and reacts slowly to business requirements. IT reliably detects/reacts in real time to the business. IT organization owns IT strategy. IT strategy is tied to business strategy. CIO = manager of IT resources. CIO = business leader. Business Needs
TheChallenge • Consolidate and transition to one streamlined and standards-based commercial facility • Transform from rigidity and lack of integration to integrated, standards-based services. • Centralize help desk functions and support of desktops and field services, improve customer satisfaction • Ensure business continuity capability and improved disaster recovery capability, increased mobility and flexibility. • Modernize antiquated IT infrastructure without disruption – while reducing costs • Measure IT performance through SLAs
TheApproach • SLA driven IT infrastructure services • Massive data center modernization • Capacity on demand • Optimum utilization for improved business application performance • Maximum standardization on fewer hardware and software platforms • Continuity of operations with minimum down-time to HUD’s critical business applications • Enterprise-wide wireless solutions • Enterprise-wide Help Desk support and centralized field dispatch
TheResults • Achievement of “green” rating on the President’s Management Agenda • Received A+ on FISMA Score Card • Enterprise Architecture Ranked Number 1 by OMB • Improved customer satisfaction to 93%! • Shared IT services cost savings of 20% • New and measurable efficiencies drive increased performance • Adoption of agency-wide SOA standards • Enhanced data integrity via security • ISO 9001 and ITIL standard based services • Massive expansion of wireless services leading to increased productivity
The Roadmap to Infrastructure Optimization Policy/Value-Based Service-Based Virtualized Rationalized Services managed holistically Dynamic opt. to meet SLAs Standardized Basic Infrastructure resources pooled Consolidate to fewer Standard resources, configurations Uncoordinated infrastructure Business agility Service-level delivery Flexibility, reduce costs Economies of scale Reduce complexity React Objective Weeks to days Months to weeks Weeks to minutes Minutes to seconds Ability to Change Weeks Minutes Variable business costs Pricing Scheme Reduced, fixed costs Fixed shared costs Variable usage costs None, ad hoc Fixed costs Class-of-service SLAs Class-of-service SLAs End-to-end SLAs Business SLAs Business Interface No SLAs Flexible SLAs Policy-based sharing Service-based pools Resource Utilization Rationalized Unknown Known Shared pools Pooled ownership Service-oriented Business-oriented Consolidated None Central control Organization Service End-to-end service management Proactive Prediction, dynamic capacity Reactive —Proactive Life cycle management Proactive Mature problem mgmt. IT Management Processes Chaotic — Reactive Ad hoc Value Policy management
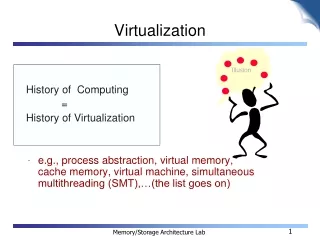
Why Virtualize? • What to Virtualize? • HUD’s Virtualization Tools • Benefits of Virtualization • Lessons Learned
HUD Server architecture - Before and After Virtualization Web Win 2003 AD Win 2003 Cust. App Win 2003 Application Solaris Application Solaris Database Solaris Traditional Infrastructure Virtual Environment Web AD 2-CPU Server Win 2003 Win 2003 Cust. App Database 2-CPU Server Solaris Win 2003 Physical to Virtual Converter Application Application 2-CPU Server Solaris Solaris 2-CPU Server VMware 2-CPU Server 2-CPU Server 2-CPU Server One OS and One App per Physical Server Many Independent Virtual Servers per Physical Server
Why Virtualize? • Large number of physical servers requiring • time consuming maintenance • Low per server resource utilization • Lengthy disaster recovery times • Various development, testing and • migration issues • Application outages impacting users • Business impacting downtime due to • server/OS maintenance • Lengthy time to provision and deploy • new services
What to Virtualize? • Production Application Servers • Test/Dev Environments • File & Print Servers • Underutilized Web and Application servers • Firewall Servers • Database servers with few to moderate users • New applications
Virtualization Tools Used • On Windows servers, used VMware technology • Hosts multiple Virtual Machines, virtualized processors and a network accessible management interface • Provides secure logical partitioning, strong fault and security isolation and dynamic allocation of system resources • On Unix servers, used the Solaris 10 OS container technology which allows the creation of “zones” • Grouping of application processes and tasks with resource controls applied • Provides virtualization, isolation and granularity
Key Business Benefits Achieved • Reduced infrastructure costs • Increased capacity utilization • Reduced applications outages due to server failures • Enabled seamless and uninterrupted support of HUD’s business in developing new business applications • Ensured compliance with OMB and FISMA standards • Reduced complexity resulting in improved recoverability of HUD's business applications from logical and physical disasters • Increased stakeholder satisfaction
Data Center Benefits • Reduction of hardware costs for servers, HBAs, network cards • Reduction of space usage and power consumption • Improved asset utilization • Automated monitoring reduces human error and outages • Improved disaster recovery • Reduction of technical support needed due to automated processes • Reduction of server/OS maintenance downtime • Rapid provisioning and deployment of new servers
Fudge Factor Growth Buffer Peak Utilization Average Utilization Increased Agility and Flexibility • Address changing business and • infrastructure requirements more rapidly • Automate and reduce time for resource • provisioning and problem resolution • Dynamic workload distribution based on • application demand and asset availability • Increase/decrease compute capacity as • workloads vary • Faster deployment of new servers • Quicker recovery times on existing • non-high availability environments
Improved Service and Delivery • Automated monitoring and management reduces • human error and outages • Re-provisioning application environments quickly • when failures occur • Dynamic workload movement between servers prior • to problem detection • Achieve affordable business continuity and disaster • recovery solutions • Management of environment becomes easier (change • management, software provisioning, DR planning, IT • cost mgmt, availability planning) • Virtual relocation prevents planned downtime from • affecting performance
HUD Vision 2010: What Has Been Accomplished The HUD National Housing Locator • The Business Challenge: Lessons Learned from Katrina – No Centralized Location to Search for Available Properties • The Solution: Single Web Portal to Locate Affordable Housing Nationwide • The Results: Implemented in January 07 – Over 30,000 Properties now available For • Though real-time web search by PHAs and First Responders
HUD Vision 2010: What Has Been Accomplished Enterprise Income Verification System The Business Challenge: HUD’s rental assistance programs designated as high-risk by GAO - estimated high level of improper rental subsidy payments of $3.2 billion in fiscal year 2000 - 70% of these errors were attributable to tenant under reporting of income. The Solution: HUD created EIV to match/verify income data for all public housing programs with the existing HHS National Directory of New Hires The Results: The annual subsidy loss associated with administrative errors and unreported income was reduced by ~$1B, which representing a 52% decrease in the annual subsidy error, and correct subsidy determinations has increased from 55.7% to over 66%
Work Force • Increased Ability to Perform Business Functions Business • Enterprise Business Solutions • Real-time Access to HUD Knowledge Repository Work Force HUD VISION 2010 ROADMAP Past - 2004 Rigidity 2005 – 2006 Consolidation 2007 – 2009 Streamlining 2010 Agility Technology Technology Business • Build Once, Service Many • Elimination of Duplicate Data Entry to Multiple Systems • Convenient Web-based, End-user Access • Enterprise Identity Management • Enterprise Content Management • Lack of Standardization • Outdated IT Infrastructure • No Documented Enterprise Architecture • Heavy Dependence on Proprietary Technology • Inefficient Use of IT Capacity • Limited IT Integration • Low Awareness of Infrastructure Problems • ISO 9001 Standards • Massive IT Modernization • Improved Web Applications • E-authentication • Nationwide IT Help Desk • E-mail Modernization • Wireless Solutions Work Force Business Technology • Self Service Solutions • Web-enabled Tele-worker • Integrated Access to Collaboration Tools • Technology Solutions for Core Business Needs • Interactive Business Processes • Improved IT Governance • Predictive Scaling of IT • Zero Dependence on Proprietary Technology • Edge Computing • Always On IT Resilience Business • Many Silos/limited Integration • Inconsistent Standards • Limited IT Governance • Limited Enterprise Solutions • Lack of Consolidation and Integration of Business Systems • Under Utilized Data Sharing Technology • ITIL Standards • Continuous Technology Refreshment • Integrated Approach to Remote Access • Integrated IT Enterprise Architecture • Secure Wireless Access to HUD Data • 84% Satisfied With HITS Support • Access to Problem Resolution Tracking • Enabled Mobile Workforce • Upgraded 5000 Desktops / Tools • Expanded Network Connectivity • Electronic Access to Core Business Data Outcome Work Force • Faster Time From Policy to Implementation • Increased Stakeholder Productivity Through Self-service Solutions • Streamlined Access to HUD Data • Maximized Resource Utilization • Agency-wide SOA Standards • Enhanced HUD Data Integrity • Centralized Data Management • Simplified End-to-end Business Processes • No Measurement of Satisfaction • Limited Problem Resolution Tracking • Paper Intensive Processes • Inefficient Work Flow Outcome Outcome • Increased Compliance • Improved Program Effectiveness Through Financial and Performance Data • Adoption of HSPD-12 • Assured COOP • Decreased Development Time for New Requirements Outcome • Green on PMA • Predictable IT Spending • High-confidence COOP • Measurable SLA Performance • Rapid Disaster Relief Mobilization • Significant Paperwork Reduction • Improved Core Business Transaction Times • Red on PMA • High IT Cost • Low ROI • Low Confidence - COOP Technology Driven Architecture Business Driven Architecture