Download
1 / 25
250 likes | 426 Views
Overview on w ater boards annual reports and tabled tariffs. Presentation to the Portfolio Committee: Water & Environment. Ms Thoko Sigwaza Chief Director: Institutional Oversight. Policy and legislative mandate. Legislative. Policy. White Paper on Water Supply and Sanitation, 1994

E N D
Overview on water boards annual reports and tabled tariffs Presentation to the Portfolio Committee: Water & Environment Ms Thoko SigwazaChief Director: Institutional Oversight
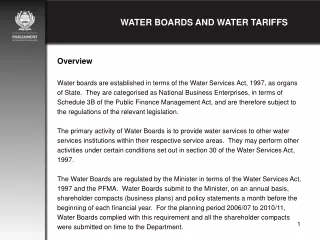
Policy and legislative mandate Legislative Policy White Paper on Water Supply and Sanitation, 1994 Strategic Framework for Water Services, 2003 • Water Services Act, Act 108 of 1997 • Public Finance Management Act (PFMA), Act 1 of 1999, as Schedule 3(B): National Government Business Enterprises
Oversight role of DWA Minister of Water and Environmental Affairs is the only shareholder
Budget vs Actual • Surplus was budgeted at R1 billion • Actual surplus was R886 million mainly due to the following: • Under achievement in sales volume due to implementation of WC/DM and better than expected rainfalls • Overruns in operating cost, especially for energy and chemical cost • Higher than expected impairment of asset value • Increased provisions for doubtful debt • Higher than expected raw water cost
CAPEX budget for next 5 years (1) • Planned spending is estimated at R 12 billion • Short and long term cash reserves are R 3.8 billion • Likely borrowing to finance CAPEX is R 8.5 billion • Surplus must be viewed in relation to asset management plan to ensure effect gearing of debt
Oversight of WBs Total bulk potable water volume supplied by WBs: 2.3 billion kiloliters per annum Total authorised abstraction: 2.36 billion cubic meters per annum WBs under spent on CAPEX by an average of 13.4% (previous year 14.5%). Total CAPEX spending for the current year was R1.5 billion Rand Water contributes 60% to consolidated turnover, Umgeni 20% and other 11 WBs 20% 14
Municipal debt to water boards Total arrears is 10.6% of total sales. Division of Revenue Act requires that the equitable share for water be paid directly to municipalities. Where municipalities face financial difficulty, they use the water equitable share for other purposes, leaving water debt owed to WBs unpaid. Changes in legislation should be considered where the equitable share is paid directly to WBs for water provided. 16
Achievements The current ratio suggests a positive cash flow No State guarantees issued to support water boards No significant demand on Government to finance expansion of WB’s bulk infrastructure Water Boards provided bulk water in 11 of the systems where Blue Drop Certificates were achieved Positive contribution to National imperatives Technical and engineering support provided to local government 17
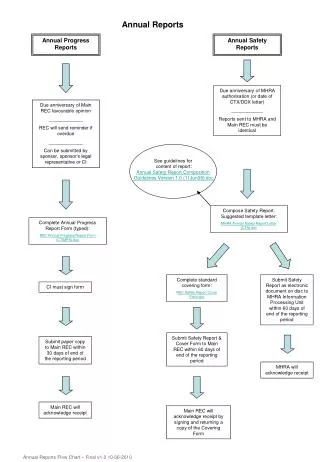
Background in tariff setting process Potable bulk water tariffs are not proposed by the Department, but are determined by WBs WBs must consult with municipalities on their proposed tariff increases (Sec 42 of MFMA, 2003) WBs must request NT & SALGA to provide written comments NT and DWA plays a monitoring and advisory role I.t.o. sec 42 of the MFMA, WBs must submit (i) the proposed amendments, (ii) the comments received & (iii) an explanation of how such comments were taken into account to the Minister , Minister must table the amendments in Parliament Tariff increases must be tabled on or before 15 March 2011, if the increases are to take effect from 1 July 2011 20
Impact of tariff increases Enable WBs to finance future CAPEX thereby reducing reliance on loans. Borrowing to finance CAPEX is estimated at R8.5 billion, partial funding of CAPEX will allow for smoothing of tariff especially in the initial years when the newly developed infrastructure will not be fully utilised. Pressure to reduce tariffs will result in a higher level of borrowing for infrastructure development, which will effectively increase tariffs to unaffordable levels in the future. From an operational point of view, the increase in energy, chemicals, labour and other cost resulted in higher than inflationary tariff increases. 22
Conclusion FOR WBs TO REMAIN SUSTAINABLE: There must be an ability to attract and retain the necessary skills to operate and maintain the service effectively. There must be a secure and adequate financial base & economies of scale. There must be the management capability to translate human and financial resources into effective service delivery. The governance environment must support good management. There must be accountability for performance. Tariff regime for the entire water sector [Independent Regulator]. 24