Software Modeling
780 likes | 921 Views
This resource provides a comprehensive overview of the Unified Modeling Language (UML), a vital tool for software and system development. It highlights how UML helps manage complexity through modeling, with a focus on various diagram types such as activity, class, sequence, and communication diagrams. Each diagram serves specific purposes in depicting system workflows, object interactions, and business processes. It also discusses the Object Constraint Language (OCL) for defining rules in UML models. Perfect for those looking to deepen their understanding of UML and its applications in real-world scenarios.

Software Modeling
E N D
Presentation Transcript
Software Modeling Juan Carlos Olivares Rojas MSN: juancarlosolivares@hotmail.com jcolivar@itmorelia.edu.mx http://antares.itmorelia.edu.mx/~jcolivar/ @jcolivares Social Network: Facebook, LinkedIn. Hi5
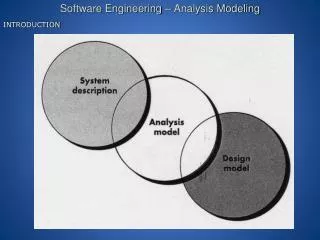
UML • The Unified Modeling Language (UML) is the standard modeling language for software and systems development. • Systems design on any reasonably large scale is difficult. • We model for one important reason: to manage complexity
UML • A model is an abstraction of the real thing. • A model is a simplification of the real system. • A particular diagram will show you some parts of your model but not necessarily everything.
UML • Stereotypes signify a special use or intent and can be applied to almost any element of UML notation. Stereotypes modify the meaning of an element and describe the element's role within your model.
Activity Diagramas Pr • Modeling System Workflows: Activity Diagrams • Use cases show what your system should do. Activity diagrams allow you to specify how your system will accomplish its goals. Activity diagrams show high-level actions chained together to represent a process occurring in your system.
Activity Diagrams Pr • Activity diagrams are particularly good at modeling business processes . A business process is a set of coordinated tasks that achieve a business goal, such as shipping customers' orders. Some business process management (BPM) tools allow you to define business processes using activity diagrams, or a similar graphical notation, and then execute them.
Activity Diagrams Pr Time Signaling Using pins for modeling I/O Transformations
Activity Diagrams Pr Signaling
Activity Diagrams Pr Partial Finally Event
Activity Diagrams Pr Swimingline
Class Diagrams L • A class has the next properties: • Abstraction • Encapsulate
Class Diagrams L Class and Objects can be restricted using OCL. OCL is representated with a Note
OCL L • The Object Constraint Language (OCL) is a declarative language for describing rules that apply to Unified Modeling Language (UML) models developed at IBM and now part of the UML standard. • OCL is a precise text language that provides constraint and object query expressions on any MOF model or meta-model that cannot otherwise be expressed by diagrammatic notation.
OCL L
OCL L • Datatypes: • Boolean true; false • Integer 1; 6,664; -200 • Real 2.7181828; 10.5 • String "Hello, World." • Operators: • Arithmetic +, -, *, / • Additional Arithmetic abs(), max(), min( ) • Comparison <, <=, >, >= • Equality =, <>
OCL L • Operators: • Boolean and, or, xor, not • String concat(), size(), substring( ), toInteger(), toReal( ) • Context: is the class we are located. Operator self indicate de selfclasse. • There are three types of constraints:
OCL L • Invariants • An invariant is a constraint that must always be trueotherwise the system is in an invalid state. • Preconditions • A precondition is a constraint that is defined on a method and is checked before the method executes. Preconditions are frequently used to validate input parameters to a method.
OCL L • Postconditions • A postcondition is also defined on a method and is checked after the method executes. Postconditions are frequently used to describe how values were changed by a method.
OCL L • Context AccountFee • inv: self.baseCost >= 0.0 • context BlogEntry::incrementRating(amount: int) : void • pre: amount <= 100 • post: rating = rating@pre + amount
Class Diagrams L Stereotype for modeling Generic Collections. Character E represent the generic type
Object Diagrams L Objects are at the heart of any object-oriented system at runtime. When the system you designed is actually in use, objects make up its parts and bring all of your carefully designed classes to life.Compared to class diagrams, object diagram notation is very simple.
Sequence Diagrams L • Sequence Diagramas Modeling Ordered Interactions. • Use cases allow your model to describe what your system must be able to do; classes allow your model to describe the different types of parts that make up your system's structure. This is where interaction diagrams , and specifically sequence diagrams, come into play.
Communications Diagrams L • The main purpose of sequence diagrams is to show the order of events between the parts of your system that are involved in a particular interaction. • Communication diagrams add another perspective to an interaction by focusing on the links between the participants .
Communications Diagrams L • Sequence and communication diagrams are so similar that most UML tools can automatically convert from one diagram type to the other. The difference between the two approaches is largely personal preference.
Timing Diagrams L • Interaction timing is most commonly associated with real-time or embedded systems, but it certainly is not limited to these domains. • In a timing diagram, each event has timing information associated with it that accurately describes when the event is invoked, how long it takes for another participant to receive the event, and how long the receiving participant is expected to be in a particular state.
Timing Diagrams L • Although sequence diagrams and communication diagrams are very similar, timing diagrams add completely new information that is not easily expressed on any other form of UML interaction diagram. Not having a timing diagram for an interaction is like saying, "I know what events need to occur, but I'm not really worried about exactly when they happen or how quickly they will be worked on.”
Interaction Overview Diagrams L • They exist to give you that big picture perspective on your system's interactions. • Interaction overview diagrams provide a high-level view of how several interactions work together to implement a system concern, such as a use case. An interaction overview looks very much like an activity diagram except that each of the actions are interactions within their own right.
Interaction Overview Diagrams L • Think of each part of an interaction overview as a complete interaction in itself. If one interaction within the overview is most concerned with timing, then a timing diagram could be employed, while another interaction of the overview may need to focus on message ordering, and so a sequence diagram could be used.
Compiste Structure Diagrams L • Composite structures show how objects create a big picture. They model how objects work together inside a class, or how objects achieve a goal. Composite structures show: • Internal structures • Ports • Collaborations
Component Diagrams D • When designing a software system, it's rare to jump directly from requirements to defining the classes in your system. With all but the most trivial systems, it's helpful to plan out the high-level pieces of your system to establish the architecture and manage complexity and dependencies among the parts. • Components are used to organize a system into manageable, reusable, and swappable pieces of software.
Component Diagrams D • UML component diagrams model the components in your system and as such form part of the development view • The development view describes how your system's parts are organized into modules and components and is great at helping you manage layers within your system's architecture.
Component Diagrams D • A component is an encapsulated, reusable, and replaceable part of your software. You can think of components as building blocks: you combine them to fit together (possibly building successively larger components) to form your software. • Because of this, components can range in size from relatively small, about the size of a class, up to a large.
Component Diagrams D • Good candidates for components are items that perform a key functionality and will be used frequently throughout your system. Software, such as loggers, XML parsers, or online shopping carts, are components you may already be using. • In UML, a component can do the same things a class can do: generalize and associate with other classes and components, implement interfaces, have operations, and so on.