Download
1 / 11
110 likes | 217 Views
Discover insights into how adults experience comparing and selecting health insurance plans through marketplaces. Explore factors influencing plan decisions and affordability for different income levels. Uncover key challenges and satisfaction levels with the marketplace experience.

E N D
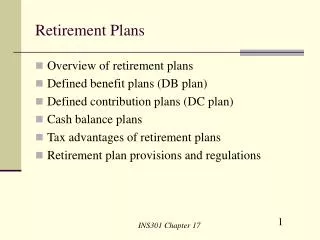
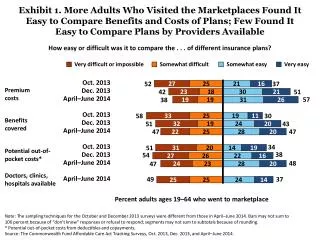
Exhibit 1. More Adults Who Visited the Marketplaces Found It Easy to Compare Benefits and Costs of Plans; Few Found It Easy to Compare Plans by Providers Available How easy or difficult was it to compare the . . . of different insurance plans? Very difficult or impossible Somewhat easy Very easy Somewhat difficult 52 37 Premium costs 42 51 57 38 58 30 Benefits covered 51 43 47 47 34 51 Potential out-of-pocket costs* 38 54 48 47 Doctors, clinics, hospitals available 49 37 Percent adults ages 19–64 who went to marketplace Note: The sampling techniques for the October and December 2013 surveys were different from those in April–June 2014. Bars may not sum to 100 percent because of “don’t know” responses or refusal to respond; segments may not sum to subtotals because of rounding. * Potential out-of-pocket costs from deductibles and copayments. Source: The Commonwealth Fund Affordable Care Act Tracking Surveys, Oct. 2013, Dec. 2013, and April–June 2014.
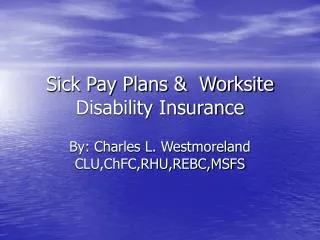
Exhibit 2. More Adults Found It Easy to Find Plans They Needed and Could Afford by End of Open Enrollment How easy or difficult was it to find. . . ? Very difficult or impossible Somewhat easy Very easy Somewhat difficult 61 30 A plan you could afford 58 37 54 43 56 38 A plan with the type of coverage you need 60 36 50 46 Percent adults ages 19–64 who went to marketplace Note: The sampling techniques for the October and December 2013 surveys were different from those in April–June 2014. Bars may not sum to 100 percent because of “don’t know” responses or refusal to respond; segments may not sum to subtotals because of rounding. Source: The Commonwealth Fund Affordable Care Act Tracking Surveys, Oct. 2013, Dec. 2013, and April–June 2014.
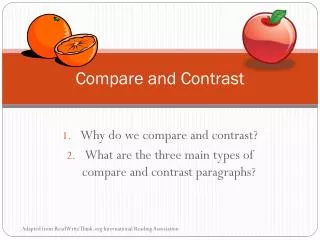
Exhibit 3. More Adults with Lower Incomes Found It Easy to Find an Affordable Plan Than Did Adults with Higher Incomes How easy or difficult was it to find a plan you could afford? Very difficult or impossible Somewhat easy Very easy Somewhat difficult 54 43 49 49 52 42 60 39 61 36 Percent adults ages 19–64 who went to marketplace Notes: FPL refers to federal poverty level. Bars may not sum to 100 percent because of “don’t know” responses or refusal to respond; segments may not sum to subtotals because of rounding. Source: The Commonwealth Fund Affordable Care Act Tracking Survey, April–June 2014.
Exhibit 4. More than Three of Five Adults Who Tried to Find Out About Their Eligibility for Financial Assistance or Medicaid Said It Was Easy to Do So Did you try to find out if you are either eligible for financial assistance to help pay for your plan, or if you are eligible for Medicaid? How easy or difficult was it to find out if you are eligible for financial assistance or for Medicaid? Did not try to find out if eligible for financial assistance or Medicaid 35% Somewhat easy 30% Tried to find out if eligible for financial assistance or Medicaid 63% Somewhat difficult 18% Very easy 33% Very difficult 18% Don’t know or refused 2% Don’t know or refused 1% Adults ages 19–64 who went to marketplace and tried to find out about eligibility for financial assistance or Medicaid Adults ages 19–64 went to marketplace Note: Segments may not sum to 100 percent because of rounding. Source: The Commonwealth Fund Affordable Care Act Tracking Survey, April–June 2014.
Exhibit 5. A Majority of Adults Who Visited the Marketplace Rated Their Experience as Fair or Poor Overall, how would you describe your experience in trying to get health insurance through the marketplace in your state? Poor Good Excellent Fair 62 38 47 52 24 76 37 63 55 44 34 65 Percent adults ages 19–64 who went to marketplace Notes: Bars may not sum to 100 percent because of “don’t know” responses or refusal to respond; segments may not sum to subtotals because of rounding. Source: The Commonwealth Fund Affordable Care Act Tracking Survey, April–June 2014.
Exhibit 6. Premiums and Cost Exposure Were the Most Important Factors in Plan Selection What was the most important factor in your decision about which plan to select? Amount of deductible and other copayments 34% Amount of premium 38% Preferred provider* included in network 20% Don’t know or refused 4% Did not formally select a plan 1% Other 4% Adults ages 19–64 who selected a private plan through the marketplace Note: Segments may not sum to 100 percent because of rounding. * Actual question wording: preferred doctor, health clinic, or hospital included in plan’s network. Source: The Commonwealth Fund Affordable Care Act Tracking Survey, April–June 2014.
Exhibit 7. Adults with Marketplace Coverage with Incomes Under 250 Percent of Poverty Paid Monthly Premiums Comparable to Those with Employer Coverage $1 to less than $125 Don’t know or refused Pays nothing $125 or more All adults Adults with incomes below 250% FPL Percent adults ages 19–64 with single policies Note: FPL refers to federal poverty level. 250% of the poverty level is $28,725 for an individual or $58,875 for a family of four. Bars may not sum to 100 percent because of rounding. Source: The Commonwealth Fund Affordable Care Act Tracking Survey, April–June 2014.
Exhibit 8. Three of Five Adults with Marketplace Coverage Found It Easy to Pay Their Premiums How easy or difficult is it for you to afford the premium costs for your health insurance? Very difficult or impossible Somewhat easy Very easy Somewhat difficult All adults 25 • 75 • 37 • 61 Adults with incomes below 250% FPL • 38 • 62 • 33 • 65 Adults with incomes of 250% FPL or more • 20 • 79 • 44 • 54 Percent adults ages 19–64 who pay all or some of premium Note: FPL refers to federal poverty level. 250% of the poverty level is $28,725 for an individual or $58,875 for a family of four. Bars may not sum to 100 percent because of “don’t know” responses or refusal to respond; segments may not sum to subtotals because of rounding. Source: The Commonwealth Fund Affordable Care Act Tracking Survey, April–June 2014.
Exhibit 9. Adults with Low and Moderate Incomes Who Had Marketplace Coverage Had Deductibles Comparable to Those in Employer Plans No deductible $1 to less than $500 $1,000 or more $500 to less than $1,000 Don’t know or refused Adults with incomes below 250% FPL Adults with incomes of 250% FPL or more Percent adults ages 19–64 Note: FPL refers to federal poverty level. 250% of the poverty level is $28,725 for an individual or $58,875 for a family of four. Bars may not sum to 100 percent because of rounding. Source: The Commonwealth Fund Affordable Care Act Tracking Survey, April–June 2014.
Exhibit 10. More Than Two-Thirds of Adults with Marketplace Coverage Rated Their Health Insurance as Excellent, Very Good, or Good Now thinking about (your current health insurance coverage/all the health insurance you have combined) how would you rate it? Poor Very good Excellent Fair Good All adults • 12 • 86 • 22 • 68 Adults with incomes below 250% FPL • 21 • 76 • 20 • 70 Adults with incomes of 250% FPL or more • 8 • 91 • 27 • 64 Percent adults ages 19–64 Note: FPL refers to federal poverty level. 250% of the poverty level is $28,725 for an individual or $58,875 for a family of four. Bars may not sum to 100 percent because of “don’t know” responses or refusal to respond; segments may not sum to subtotals because of rounding. Source: The Commonwealth Fund Affordable Care Act Tracking Survey, April–June 2014.
Exhibit 11. A Majority of Adults with Marketplace Coverage Were Confident They Could Afford Care They Needed or Get High-Quality Care How confident are you that if you become seriously ill you will be able to . . . ? Not at all confident Somewhat confident Very confident Not very confident Afford the care you need • 18 • 81 • 30 • 70 • 60 • 38 • 73 • 25 Get high-quality care • 84 • 15 • 27 • 71 • 31 • 65 • 63 • 36 Percent adults ages 19–64 Note: Bars may not sum to 100 percent because of “don’t know” responses or refusal to respond; segments may not sum to subtotals because of rounding. Source: The Commonwealth Fund Affordable Care Act Tracking Survey, April–June 2014.