Download
1 / 15
150 likes | 308 Views
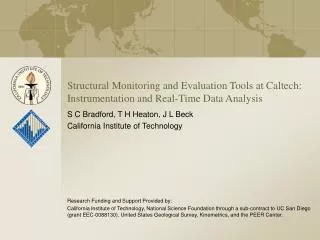
Structural Monitoring and Evaluation Tools at Caltech: Instrumentation and Real-Time Data Analysis. S C Bradford, T H Heaton, J L Beck California Institute of Technology. Research Funding and Support Provided by:

E N D
Structural Monitoring and Evaluation Tools at Caltech:Instrumentation and Real-Time Data Analysis S C Bradford, T H Heaton, J L Beck California Institute of Technology Research Funding and Support Provided by: California Institute of Technology, National Science Foundation through a sub-contract to UC San Diego (grant EEC-0088130), United States Geological Survey, Kinemetrics, and the PEER Center.
Overview • Dynamic properties of an instrumented Caltech building: • Natural frequencies temporarily decrease by 4% during strong winds! • Natural frequencies temporarily increase by 5% during rainfall! • The natural frequencies vary on several time scales. • Analysis of Real Time Data • Caltech Online Monitoring and Evaluation Testbeds (COMET) • Implications for Structural Health Monitoring techniques that infer damage based on changes in modal parameters
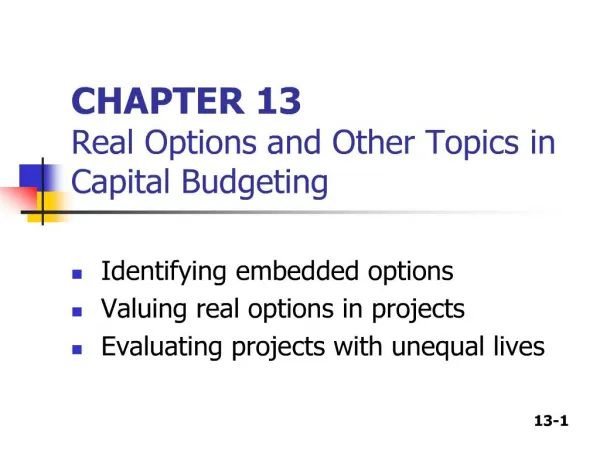
Robert A Millikan Memorial Library Millikan Library, one of the worlds most heavily researched and instrumented buildings, has been studied extensively since its construction in the mid 1960s. Very stiff 9-story reinforced concrete building with one basement and no foundation piles. A synchronized vibration generator (“shaker”) is installed on the roof for forced vibration tests. USGS/Caltech Dense Instrumentation Network installed in 1998 -- 36 FBA-11 instruments, three horizontal stations on each floor (basement-roof) and three vertical stations in the basement. Digitized with two parallel systems: • Mt Whitney digitizer/datalogger records triggered events • Digitexx digitizer system streams real-time data to client computers California Integrated Seismic Network (CISN) station MIK installed in 2001. Three-component episensor on 9th floor, Quanterra datalogger (this station is part of the COMET system).
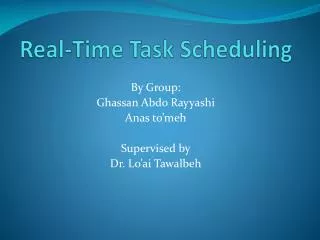
Historical Behavior of Millikan Library Fundamental EW and NS modes of Millikan Library since construction. Crosses indicate frequencies from forced vibration tests. Circles indicate natural frequency estimates from recorded earthquake events, and numbers in italics are peak roof accelerations from the event (cm/s2). Dashed lines represent the observed natural frequencies of the library, and the shaded region is the likely variance from such factors as weather conditions, weight configuration of the shaker used for forced vibration tests, and experimental error. [Earthquake Abbreviations: LC: Lytle Creek, SF: San Fernando, WN: Whittier Narrows, SM: Santa Monica, NR: Northridge, BH: Beverly Hills, BB: Big Bear] - (Clinton, 2004)
EW1 T1 EW2 EW3 NS1 T1 NS2 Frequency Domain From one day of ambient data, an FFT shows the fundamental frequencies of the library. The characteristics of an FFT (including the fundamental frequencies) change on several time scales.
One Week of Data A spectrogram of MIK (EW component) consisting of one week of data, with a running FFT of one hour. Colorbar indicates log amplitude of FFT. The vertical stripes in the spectrogram are quiet periods, the AC system turns off nightly from Midnight-4AM.
Days Years Weeks Dynamic Properties of Millikan Library vary on different timescales: Clinton, 2004
Big Bear Earthquake M5.4 D=119 22Feb2003 Forced Vibration Testing Santa Ana Windstorms
Big Bear Earthquake M5.4 D=119 22Feb2003 Forced Vibration Testing Santa Ana Windstorms
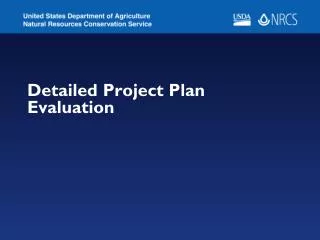
Weather Conditions Clinton, 2004 Examining data from extreme weather events, we can see that both strong winds and heavy rains can affect the dynamic behavior of the library. Heavy winds have been observed to temporarily decrease all fundamental frequencies by 2-4%. The building recovers immediately after the wind event. Rainfall causes an increase in the EW and Torsional fundamental frequencies of 3-5%, the NS mode is less strongly affected by rain. Rain effects persist for 1-2 weeks, gradually reverting to pre-rain levels.
COMEThttp://comet.caltech.edu The COMET site acts as an interface to the CISN database for two Caltech stations: MIK (three channels from Millikan Library) and CBC (eight channels from the Broad Center). 24-bit data is stored at 80sps for MIK and 100sps for CBC. Users can: • Download data from the COMET archives • Download real-time data • Display data from the archives or in real time • Run the MODE-ID application on archived or real-time data
COMEThttp://comet.caltech.edu The COMET site acts as an interface to the CISN database for two Caltech stations: MIK (three channels from Millikan Library) and CBC (eight channels from the Broad Center). 24-bit data is stored at 80sps for MIK and 100sps for CBC. Users can: • Download data from the COMET archives • Download real-time data • Display data from the archives or in real time • Run the MODE-ID application on archived or real-time data
Conclusions Ambient studies of Millikan Library have helped to quantify the changes in natural frequency that occur at several time scales. Weather patterns strongly affect the behavior of the building: - Temporary 4% decrease for strong winds, recovers immediately - Temporary 5% increase for heavy rains, recovers over ~weeks Caution is needed when applying Structural Health Monitoring techniques that use a change in fundamental frequencies to infer structural damage.