Download
1 / 2
20 likes | 151 Views
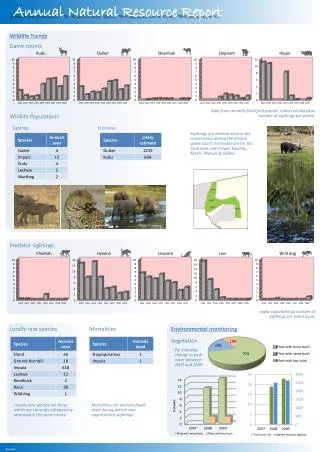
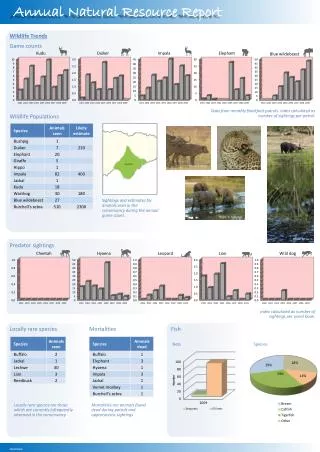
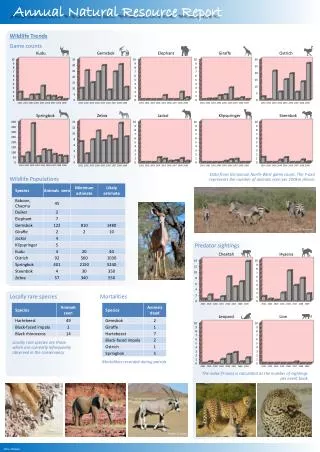
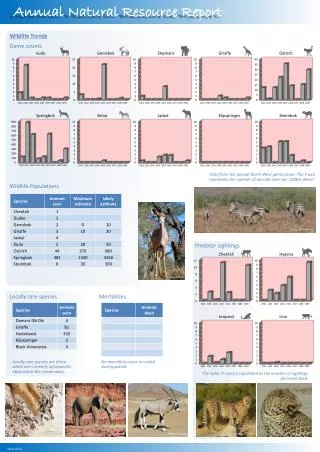
This annual report provides detailed insights into wildlife trends based on data from the North-West game count, focusing on the number of animals observed per 100 km driven. It highlights locally rare species and monitors mortalities, with no recorded deaths during recent patrols. The report features an index of predator sightings and assesses the performance of natural resource management, including human-wildlife conflict and poaching incidents. Additionally, it addresses weak areas requiring attention and evaluates the effectiveness of interventions in wildlife conservation.

E N D
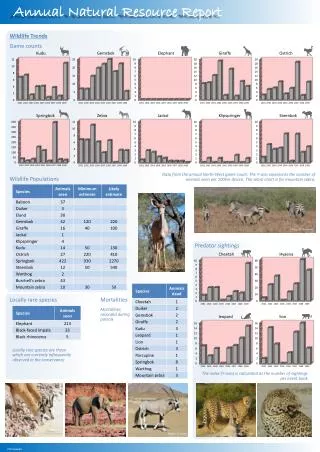
Annual Natural Resource Report Wildlife Trends Game counts Data from the annual North-West game count. The Y-axis represents the number of animals seen per 100km driven. Wildlife Populations Photo: V. Guillemin Predator sightings Photo: A. Jarvis Locally rare species Mortalities Locally rare species are those which are currently infrequently observed in the conservancy No mortalities were recorded during patrols The index (Y-axis) is calculated as the number of sightings per event book Photo: A. Jarvis Photo: S. Linder Photo: S. Linder Photo: V. Guillemin Photo: A. Jarvis SorrisSorris
SorrisSorris- 2009 Wildlife Use Wildlife Income Wildlife Introductions Photo: H. Denker Natural Resource Management Threats Performance: Human-Wildlife Conflict Poaching WeakGood Incidents Incidents Species 2009 Environmental monitoring Red bars indicate weak areas in the conservancy management performance which need to be addressed. Green bars indicate positive management performance. Rainfall (mm) Effort: Damage The species chart indicates the most troublesome to least troublesome conflict species in the conservancy. The Y-axis in HWC and poaching charts represents number of incidents. Years with no bars indicate gaps in data collection SorrisSorris