Pertemuan 10 Database Management System & Data Modelling
Pertemuan 10 Database Management System & Data Modelling. Matakuliah : TI307 / Sistem Informasi Tahun : 20 12 Versi : 1. Learning Outcomes. Pada akhir pertemuan ini, diharapkan mahasiswa akan mampu : Mahasiswa dapat Menerangkan pengertian manajemen data dan basis data (C2)

Pertemuan 10 Database Management System & Data Modelling
E N D
Presentation Transcript
Pertemuan 10Database Management System & Data Modelling Matakuliah : TI307/SistemInformasi Tahun : 2012 Versi : 1
Learning Outcomes Pada akhir pertemuan ini, diharapkan mahasiswa akan mampu : • Mahasiswa dapat Menerangkan pengertian manajemen data dan basis data (C2) • Mahasiswa dapat Menyesuaikan berbagai bentuk manajemen data dengan kebutuhan perusahaan (C3)
Outline Materi • Data organization • Database structure • A relational database example • Creating database • Using the database • Managing the database • Database management system in perspective • ERD • Putting data modelling in perspective
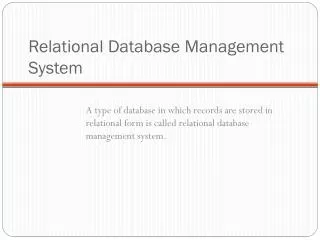
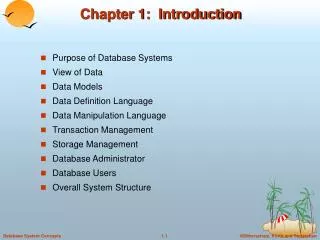
Introduction • Database management systems organize the large volume of data that firms use in their everyday business activities • The data organization must also allow managers to find specific data easily and quickly for decision making • The increased importance of databases as resources supporting decision making has required managers to learn more about database design and use
DATA ORGANIZATION • Firms need very large amounts of data stored in their computer-based information systems simply because they conduct so many business transactions • So much data exists that it would be useless for business decision making without an effective and efficient manner for organizing the data • In order to use the data and avoid chaos, the “data” concept has to be broken down and reduced to smaller concepts • These smaller concepts of data form the building blocks that can be combined to reproduce the original data in an organized, accessible format
The Data Hierarchy • Business data is organized into a hierarchy of: • data fields that combine to form records; and • records that combine to form database files • A data field is the smallest unit of data representing the smallest amount of data that might be retrieved from a computer at a given time • A record is a collection of related data fields • A file is a collection of related records, such as a file of all records containing course codes and title fields • Table 6.1 shows an example of a database file
The Spreadsheet As a Simple Database • A table of rows and columns can be represented in a spreadsheet • The columns of the spreadsheet represent the data fields while the column headings contain data field names • Rows of the table contain the field values • Figure 6.1 illustrates an Excel spreadsheet containing the values from the COURSE table shown in Table 6.1
Flat Files • A flat file is a table that does not have repeating columns • A flat file provides the constant sequence of data fields that database management requires • Flat files allow relational database structures to be normalized • Normalization is a formal process for eliminating redundant data fields while preserving the ability of the database to add, modify, and delete records without causing errors
Key Fields • Table 6.3 depicts values in the BOOK table and illustrates the concept of a key • The key in a table is a field (or combination of fields) which contains a value that uniquely identifies each record in the table • A single field often serves as a key for a table. • Distinguishing between two or three rows is not enough, key values must be unique for the entire table • A candidate key is a field that uniquely identifies each table row but was not chosen to be the key
Key Fields (cont.) • Some tables require the values of two or more fields to uniquely identify each row in the table • An example would be when courses have projects • Table 6.4 shows projects but note that no single data field value uniquely identifies each row • Values in the Code field column repeat between rows. So do field values in all other columns • The combined values in the Code and Number fields, however, do form a unique value
Relating Tables • Sometimes it may be necessary to join tables that originally stand alone • Consider Table 6.5, the DEPARTMENT table. It shows the six departments offering the courses in the COURSE table • Note that the tables have no column in common. • You might be able to guess which department offered each course based upon the values in the Abbreviation field but a computer needs an exact match, not a guess • Table 6.6 depicts the COURSE table with the Abbreviation added
DATABASE STRUCTURES • Database structures are ways of organizing data in order to make data processing more efficient • The structure is then implemented via a database management system(DBMS) which is a software application that: • stores the structure of the database; • stores the data itself; • stores the relationships among data in the database;and • forms and reports pertaining to the database including the data field description • Because it contains the data field definitions, the database controlled by a DBMS is called a “self-describing set of related data”
Hierarchical Database Structures • The IDS database management system was one of the first DBMS and conformed to the hierarchical database structure • The hierarchical structure is formed by data groups, subgroups, and further subgroups • Figure 6.2 shows navigation from the DEPARTMENT table to the COURSE table using a hierarchical database structure
Network Database Structures • Network database structures were developed to allow retrieval of specific records • They allow any given record to point to any other record in the database • Networks solve the problem of having to backtrack all the way to a joining “branch” of the database • However, this wide range of possible connections is also the weakness of applying network structures to practical problems since it was just too complex to allow every record to point to every other record
Relational Database Structures • The breakthrough came from basic research conducted independently by C. J. Date and E. F. Codd using relational algebra • They were able to show that relational databases created out of a series of interrelated tables were, in fact, far more flexible and versatile than either the hierarchical or network database structures • Whereas the hierarchical and network database structures rely on physical relationships in the form of storage addresses, relational database structures use implicit relationships that can be implied from the data (see Figure 6.3)
A RELATIONAL DATABASE EXAMPLE • A database named Schedule has been created from tables used earlier in the chapter and some others • The database is implemented in Microsoft Access 2002 (also known as Access XP). • Databases break information into multiple tables because if information were stored in a single table, many data field values would be duplicated
The Schedule Database • The example is implemented on Microsoft Access dbms but would be similar on any relational dbms product • The COURSE table in Access (Figure 6.4) is a list of data field values. The table itself had to be defined in Access before values were entered into the data fields • Figure 6.5 shows the definition of the Code field • Figure 6.6 illustrates that Abbreviation field values will be looked up from a list of values in the DEPARTMENT table • Table 6.7 shows a single table of course and department fields before they were separated into different tables
The Database Concept • The logical integration of records across multiple physical locations is called the database concept. It is not dependent on the user's perception of logical location • Two primary goals of the database concept are to minimize data redundancy and to achieve data independence • Data independence means placing the data specifications in tables and dictionaries that are physically separate from the programs • Data dictionary refers to the definition of data stored within the database and controlled by the DBMS
CREATING A DATABASE • In the conceptual model you: • Determine the data that you need • Describe the data • Enter the data into the database
Determine the Data Needs The two main approaches to determine data needs are: • The Process-Oriented Approach: • 1. The problem is defined • 2. The decisions required to solve the problem are identified • 3. For each decision the required information is described • 4. The processing necessary to produce the information is determined • 5. The data required by the processing is specified • The Enterprise Modeling Approach • the firm’s entire data needs are determined and then stored in the database • The enterprise data model is shown in Figure 6.8
Data Modeling Techniques • Modeling the firm's data needs is supported by techniques that: • Describe the data • Describe how the data aggregates into tables • Describe how tables relate to each other • Entity-relationship diagrams are used to describe relationships between conceptual collections of data so that their related records can be joined together • Class diagrams are used to describe both the data relationships and the actions that operate on the data in the relationships
Entity-Relationship Diagrams • ER Diagrams deal with data in entities (conceptual collections of related data fields) and the relationships between entities • If we need to describe the data needed for a new information system to keep track of firms and their employees as well as their products, we can imagine that three separate data entities will exist: firm, employee, and product (Figure 6.9) • When firms hire employees, however, there is an independent relationship between those two entities (Figure 6.10) • Figure 6.11 demonstrates how we specify that one record in the firm entity can be related to many records in the product entity and also that one record in the firm entity can relate to many records in the employee entity • Figure 6.12 is a “many-to-many” example
Class Diagrams • When both the data used in an application and the actions associated with the data can be graphically represented they are called class diagrams and they are one of several object-oriented design models • Class diagrams consist of the named class, fields in the class, and actions (sometimes referred to as methods) that act upon the class • The class diagram in Figure 6.13 illustrates the entity-relationship diagram we have just completed
USING THE DATABASE • Consider a database on a personal computer • Forms, reports, and queries are common methods for accessing the database held in a database management system • A query language is the means for asking questions of the database • Many database management systems provide an easy-to-use interface for the user
Reports and Forms • The majority of users' interactions with databases are via reports and forms • Graphical user interfaces (GUIs) are provided by most database management software vendors to make the development of forms and reports easier • The greatest difference between forms and reports is in their format • Figure 6.14 shows a form for entering courses into the database • Figure 6.15 illustrates a form and subform combination
Reports and Forms (cont.) • Reports are aggregated database data formatted in a manner that aids decision making • Figure 6.16 is a report that shows each department with a list of each course taught and projects required for the course • Figure 6.17 illustrates that the DEPARTMENT table relates down to the COURSE table which, in turn, relates down to the PROJECT table • Unless there was a related entry in the PROJECT table, no COURSE record was displayed. If no record from the COURSE table was used (for example, neither economics course had a project) then a DEPARTMENT record was not displayed