Download
1 / 62
620 likes | 779 Views
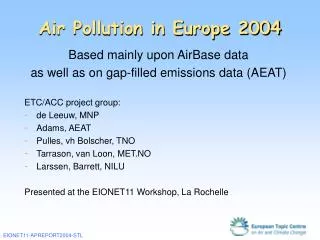
Development in Air Pollution Data Collection in Europe. Hans Eerens Introduction Establishment European Environmental Agency (EEA) and its Topic Centres A common European Environmental Information system (EIONET): Air Quality (and Emission) database through AIRBASE

E N D
Development in Air Pollution Data Collection in Europe Hans Eerens • Introduction • Establishment European Environmental Agency (EEA) and its Topic Centres • A common European Environmental Information system (EIONET): Air Quality (and Emission) database through AIRBASE • Presentation of data: Air Pollution Indicators & Urban Air Pollution • Integrated Assessment of Air Pollution & Climate Change: the next steps
Introduction: Development European Community Legislation Around 1975: EC establish an air pollution expert working group: Gathering urban air quality data (mostly SO2), main focus on QA/QC of measurement methods and site selection 1979: Legal structure EoI (Exchange of Information) directive: Member states selects a representative number of measurement stations to EC, EC stores data and yearly report data 80’s: Directives for SO2 and particles, Lead and NO2 1990: EoI directive ends 10 year period, new EoI needed countries decide to continue on a voluntary basis, development of Girafe (Guide of Air Quality Monitoring Networks in Europe)
Introduction: Development European Community Legislation • 1992: Ozone directive • 1996: Air Quality Framework adopted: general principles for pollutant directives set • 1997 new EoI adopted, all measurement stations that measures a component on the list (.. Components) has to be reported (in 2001 amended) • 1998 EU provides countries with DEM, a data exchange module to convert national data to Airbase, EEA starts to provide yearly Air pollution reports based on the data provided.
Introduction: Development European Community Legislation • 1999: First Daughter directive adopted (PM10, So2, No2, lead) • 2000: Second daughter directive: CO and Benzene • 2001: Third Daughter directive: Ozone • 2001: Emission Directive (NEC): SO2, NOx, VOC, NH3 national emission ceilings for 2010 set • 2001: CAFE (Clean Air For Europe) is launched: a thematic strategy is foreseen for 2004 • coming up: Daughter directives for PAH’s and heavy metals (Ni, Cd, As, Hg)
Introduction: Summary Monitoring and reporting air emissions and air quality data is required under • CLRTAP protocols • EU legislation (air quality/emission Directives) • UNFCCC
Background EEA • A European Union institution • Established by EU Regulation • Staff: about 80 • Budget: ca. 20 M Euro • Seat: Copenhagen EEA home page: www.eea.eu.int
The EEA mission “Through the provision of timely, targeted, relevant and reliable information to policy making agents and the public, the EEA aims to help achieve significant and measurable improvement in Europe’s environment”
EEA member and partner countries EU Member States + Norway Iceland Liechtenstein +East Europe, Malta, Cyprus (members in 2001) NIS
ETC/ACC: general information • Established April 2001 for three years • Lead organisation: RIVM, the Netherlands • Around 10 -15 man year/year • Successor of two ETCs: Air Emissions and Air Quality • Focus on Air Pollution and Climate Change
ETC/ACC: A truly European consortium Lead organisation: National Institute of Public Health and Environment (RIVM)12 Partners: UBA- Berlin, Germany IIASA, Austria NILU, Norway UBA- Vienna, Austria AEAT, United Kingdom AUT, Greece CHMI, Czech Republic ICCS-NTUA, Greece DNMI, Norway SHMU, Slovakia TNO-MEP, The Netherlands Öko-Institute, Germany
ETC/ACC: Vision and Priorities • Partnership with countries and stakeholders • Consolidate monitoring work • Support Air Pollution and Climate Change Policies • Enhance linkages between air emissions and air quality • Explore cross-benefits between Climate Change and Air Pollution policies
Integrated Assessment (ACC) Economy & population D energy transport industry agriculture tourism P CO2 GHG SO2 NOx VOC NHx PM10 Emissions Air quality S SO2 NO2 O3 PM10 SO2 NO2 O3 PM10 regional urban I Health Ecosystems Materials R ECCP CAFE
Practical aspects - Air Emissions • Indicator reports • Guidebook • Reporting software: • CollectER • ReportER • Internet data service
Practical aspects - Air quality • Indicator reports • Guidance documents • EUROAIRNET monitoring network • AIRBASE information system • AQ-DEM reporting software • Model Documentation System • Internet data service
Country Support Tools for Air Quality • Database • Airbase • Web based applications (etc-acc.eionet.eu.int) : • AIRVIEW • MDS (Model catalogue) • (ON LINE OZON WEBSITE) • PC-application: • DEMv5
EIONET • EEA supports and helps improving and streamlining national reporting • Assessment and reporting is carried out in close contact with national coordination centers and expertise centers (meetings, workshops, informal contacts)
AIRBASE • AQ Data collection based on “Exchange of Information Decision“ (EoI) • pan-European • Metadata of air quality measurement stations in Europe (information about networks, stations and measurement configurations) • Air quality measurement data (raw data, statistics) of more than 30 countries • available to general public
AIRVIEW • Facilitates interactive access to AIRBASE • Visualisation of data in the form of maps, graphs or tables • Java based applet application • http://www.etcaq.rivm.nl/databases/ airview.html
Weekday dependence of ozone concentrations • …can provide information concerning the effect of emission reductions on Ozone • NMVOC and NOx emissions are ca 30 % lower during weekend days than during working days
Ozone 1,4 1,3 1,2 1,1 1 0,9 Normalized concentration 0,8 0,7 0,6 0,5 0,4 0 1 2 3 4 5 6 7 8 Saturday Sunday Monday Tuesday Wednesday Thursday Friday The Ozone weekend effect
Nitrogen Dioxide 1,4 1,3 1,2 1,1 1 Normalized concentration 0,9 0,8 0,7 0,6 0,5 0,4 0 1 2 3 4 5 6 7 8 Saturday Sunday Monday Tuesday Wednesday Thursday Friday The Ozone weekend effect
Urban ozone trends are more positive O3 trends all stations > 5 full years 15 10 urban rural 5 0 -15 -10 -5 0 5 10 15 trend (%/y)
Ozone summary (1994-2000) 50 P 98 P # stations (> 1my) 1787 1788 > 5 monitoring years 645 645 upward trend 127 13 downward trend 11 165
Exceedance days Ozone (1994-2000) 180(1h) 110(8h) 65(24h) # stations (>1my) 1868 1804 1745 > 5 mon years 664 586 592 upward 6 15 53 downward 131 131 83 zero 87 3 0
DEM (Data Exchange Module) • Facilitates data transmission from countries to AIRBASE • PC-application • Add, modify and delete meta information on AQ networks, stations and measurement configurations • Visualise imported data • Generate reports giving an overview contained in application
DEM • Transmitting the database through Internet (Ftp) for incorporation in Airbase • Next cycle, next year: The DEM is sent to the countries; the DEM is pre loaded with all actual meta information of AIRBASE. The countries are asked to correct and complete the meta information and to add the data of the last year
DEM • Exchange of Information Decision 97/101/EC (from 2002: 2002/752/EC) • Directive 92/72/EC (Ozone) • EEA-Euroairnet • EMEP Task Force Measurement and Modelling
Summary: Country Support Tools for Air Quality Accessible by Website • URL: etc-acc.eionet.eu.int • Interactive access to AIRBASE (Airview) • Download DEM • Information
ENVIRONMENTAL INDICATORS • representative • transparent • distinctive • consistent within DPSIR-chain • target value
Air Pollution Indicators Building blocks for: • Environmental Signals report of EEA • sectoral reports (TERM, EERM) • Kiev report (ministerial conference) • Air Quality & Air Pollution reports • …...
Air Pollution Indicators Core set-pressure: • emissions acidifying pollutants • emissions ozone precursurs • emissions prim & sec PM10 • emissions SO2, NOx, VOC, NH3
Air Pollution Indicators Core set-impact & response (under development): • human health exposure and risk by air pollution • effectiveness policy response SO2 and NOx