Download
1 / 29
290 likes | 445 Views
CLIMATE CHANGE IN THE SOUTHWEST. Maps & graphs courtesy Dr. Kelly Redmond Regional Climatologist/Deputy Director Western Regional Climate Center Desert Research Institute Reno, Nev. 2008: 266 of 366 days, No sunspots. Most spotless days since 1913 with 311 days.

E N D
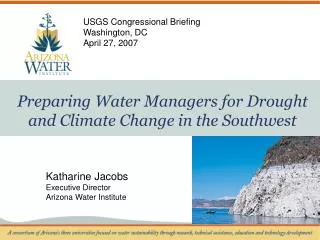
CLIMATE CHANGE IN THE SOUTHWEST Maps & graphs courtesy Dr. Kelly Redmond Regional Climatologist/Deputy Director Western Regional Climate Center Desert Research Institute Reno, Nev.
2008: 266 of 366 days, No sunspots. Most spotless days since 1913 with 311 days. 2009 through May 2: 117 days (87 pct of year). Typical solar min: 485 spotless days. This solar min thru May 2: 617 spotless days. spaceweather.com
Annual Winter Summer IPCC 2007 Late 21st T (C) P (%) Agree ? Thanks to Phil Mote
Seager et al, 2007. Average of 19 climate models. Figure by Naomi Naik. www.ldeo.columbia.edu/res/div/ocp/drought/science.shtml
21 Years From 2009 R. Seager, M.F. Ting, I.M. Held, Y. Kushnir, J. Lu, G. Vecchi, H.-P. Huang, N. Harnik, A. Leetmaa, N.-C. Lau, C. Li, J. Velez, N. Naik, 2007. Model Projections of an Imminent Transition to a More Arid Climate in Southwestern North America. Science, DOI: 10.1126/science.1139601
Winter Spring Summer Autumn Annual Annual Temperature Trend 1976 - 2005 National Temperature Trend by Season The Last 30 Years
2000 2001 2002 2003 2004 2005 2006 2007 2008 United States Annual Temperature Departure from 1950-1995 Mean NOAA Divisional Data, Western Regional Climate Center, Plotted by ESRL PSD
Thru Dec 2008 NOAA National Climatic Data Center
Through March 2009 “El Nino” “La Nina” NOAA ESRL (“CDC”), Wolter and Timlin
Global Sea Surface Temperature Anomalies ( C ) 2009 May 24-30 NOAA ESRL (“CDC”)
Recent Evolution of Equatorial Pacific SST Departures Updated through 2009 May 24-30
Sep 26, 2000 Sep 25, 2001 Sep 28, 1999 Sep 21, 2004 Sep 24, 2002 Sep 30, 2003
Sep 27, 2005 Sep 26, 2006 Sep 25, 2007 Sep 30, 2008 Jun 02, 2009
Lake Powell Storage Through June 4, 2009 Currently 62 % full (capacity 24.17 MAF) Minimum: 33 % full on April 8, 2005
Lake Powell Elevation Through June 4, 2009 Water level on Apr 17, 2009 was 3631.19 ft, - 69 ft below full. Minimum level on April 8, 2005 was 3555 ft, -145 ft below full. Source: www.usbr.gov/uc/water/index.htl
Water Year 2008 Oct 1 Thru 2009 Jun 4
Water Year 2008 Oct 01 Thru 2009 May 01
May 2009
Historical Climatology Network – Modernized Survey Progress as of 2009 June 8
Western Basins • Water Year Precipitation • from • Snotel Stations • Percent of Average • 2008 October 01 • thru • 2009 June 05
Western Basins • Snow Water Content • from • Snotel Stations • Percent of Average • 2009 June 05
www.cefa.dri.edu/Westmap or www.wrcc.dri.edu/Projects (select Westmap)
Select type of product, set up display parameters, select location for time series or domain for map. Time Series Monthly Fixed temperature Fixed height Pct precip as snow Daily Fixed temperature Fixed height Maps Monthly / Daily Fixed temperature. Mean / departure Fixed height Mean / departure Product Setup Graph parameters Period / duration Color scheme Absolute vs departure
? Is the current Southwest drought a once-or-twice-a-century drought like those of the past 500 years … ? ? … or … a harbinger of things to come, a different type of drought that we have not observed before ? ?