Download
1 / 15
150 likes | 279 Views
Type Ia Supernovae in Galaxy Clusters from the CFHT Supernova Legacy Survey (SNLS). Melissa L. Graham, C. J. Pritchet, and the SNLS Team University of Victoria, Canada. SkiLS/AstroSki, January 2007, Mt Washington. Why SNIa in Galaxy Clusters?.

E N D
Type Ia Supernovae in Galaxy Clusters from the CFHT Supernova Legacy Survey (SNLS). Melissa L. Graham, C. J. Pritchet, and the SNLS Team University of Victoria, Canada. SkiLS/AstroSki, January 2007, Mt Washington
Why SNIa in Galaxy Clusters? 1) Evidence that SNIa rate per unit mass low in clusters 2) SNIa rate per unit mass now known to be an order of magnitude lower in early type galaxies So, is morphology-density relation the sole affect on the SNIa rate per unit mass in clusters? ? Galaxy Cluster Abell 1689: N.Benitez, T.Broadhurst, H.Ford, M.Clampin, G.Hartig, G.Illingworth, ACS Science Team, ESA, NASA (APOD) SNIa diagram: Scott Hilditch, Lancaster University, http://www.lancs.ac.uk/ug/hilditch and also http://astro.berkeley.edu/~ehuff/cosmology_files
MegaCam CFHT Data from CFHTLS. SNIa The SNLS SNIa Catalog http://legacy.astro.utoronto.ca Galaxies The Ilbert Photo-z Catalog Ilbert et al. 2006, A&A 457 3 841. - restricted to i' < 24.0 Clusters The Olsen Optical Cluster Catalog Olsen et al. 2007, A&A 461 1 81. Olsen cluster catalog complete to redshift approx. 0.7, so all catalogs restricted to z<0.8. current total = 278+
Expected SNIa Rate for Galaxies. SNIa rate in a galaxy is the sum of two components: SNRIa = (A x M) + (B x SFR) [# SNIa per year] A = (5.3 ± 1.1) x 10-14 SNIa/year/unit stellar mass B = (3.9 ± 0.7) x10-4 SNIa/year/unit star formation rate (Sullivan et al. 2006, ApJ 648 868.) SNRIa normalized to make the total number expected in the field equal to the total number observed.
Identify SNIa and Galaxies in Clusters. - consider diameters 400kpc and 800kpc - environment depth used was ±0.05(1+z) of the cluster's redshift Diameter 0.4 Mpc Cluster z=0.3 05D3mq, z=0.246 Diameter 0.4 Mpc Cluster z=0.5 03D1ax, z=0.496 Diameter 0.8 Mpc Cluster z=0.4 05D3mx, z=0.47 Diameter 0.8 Mpc Cluster z=0.65 05D4ef, z=0.606
Summed Poisson Probabilities Probability of observing x SNIa in clusters given the expected number µ : For x > µ Or, for x < u
Comparing # SNeIa Observed to Expected in Clusters Using both A+B rate components: Diameter # SNIa # SNIa Sum Poisson # For A Significant. [Mpc] Observed Expected Probability Result (P<5%) 0.4 2 2.80 0.47 7 0.8 4 4.19 0.59 0, 9 Using rate component A only: Diameter # SNIa # SNIa Sum Poisson [Mpc] Observed Expected Probability 0.4 2 3.70 0.29 0.8 4 5.31 0.39
Completeness Issues: • 1) Detection efficiency drops in brighter galaxies, and early types are brighter and more likely to be in clusters 2) Detection efficiency drops for fainter SNIa, and Sullivan et al. 2006 show that fainter SNIa occur more often in early type galaxies • Conclusions: • 1) SNIa rate per unit mass in clusters consistent with rate in field galaxies, to within a factor of 2, with 95% confidence 2) SNIa rate per unit mass in cluster and field early type galaxies is also consistent. 3) With a cluster sample 3 times the CFHTLS sample size, rate affects outside the morphology-density relation can be detected 03D1ax at z=0.496 Other Work: 1) Use of clustering parameter significance to compare rates on continuous clustering scale. (Ask me how!) 2) Use of detection efficiencies from Neill et al. 2006 to correct number of SNeIa observed in field and clusters, and derive a SNIa rate per unit mass in clusters.
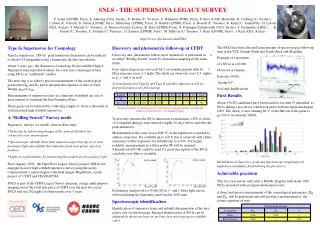
Observational Program: - deep component of CFHT Legacy Survey - MegaCam images four 1 sq.deg. fields spread out in RA in u*g’r’i’z’ - images every two to three days (rest frame) - depth of approximately i’<25, so SNeIa to z=1.0+ Science Goals: - constrain w, the equation-of-state-parameter for dark energy - derive rates and evaluate properties of SNeIa to constrain their progenitor scenarios Collaborators: Victoria, Canada: Chris Pritchet, Dave Balam, Don Neill, Eric Hsiao, Me Toronto, Canda: Ray Carlberg, Mark Sullivan, Andy Howell, Kathy Perrett, Alex Conley France: Reynald Pain, Pierre Astier, Julien Guy, Nicolas Regnault, and more. Other: Isobel Hook, Saul Perlmutter, and more. http://legacy.astro.utoronto.ca
Significance Parameter The significance (Σ) of clustering in its environment is: For a cylidrical volume centered on galaxy or SNIa: redshift depth ±0.05(1+z) AE Environment depth represents photometric redshift uncertainty of Ilbert Galaxy Catalog. Intermediate environment diameter of 0.6 Mpc adopted for following experiment. NE = number in environment NF = number in field AE = area of environment AF = area of field
Evaulating SNIa Rate per Unit Mass in Olsen Clusters Ncorr,Ia = number of SNIa per yea r in deep fields NIa = number of observed SNIa in deep fields S = number of seasons of SNLS observing εyr = detection and identification efficiency of SNeIa CSPEC = fraction of unidentified SNeIa which have spectra <z>V = volume-weighted average redshift of survey
Evaulating SNIa Rate per Unit Mass in Olsen Clusters SNRIa in E/S0 = (5.3 ± 1.1) x 10-14 SNIa/year/M⊙ (Sullivan et al. 2006) SNRIa in low redshift clusters = 7.4(+4.4-2.9 ±2.1) x 10-14 SNIa/year/M⊙ (Sharon et al. 2006)