Download
1 / 19
190 likes | 388 Views
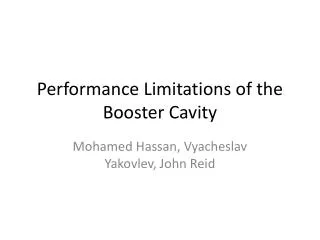
Performance Limitations of the Booster Cavity. Mohamed Hassan, Vyacheslav Yakovlev , John Reid. Booster Parameters. The Fermilab Booster is a synchrotron that accelerates protons from 400 MeV to 8 GeV

E N D
Performance Limitations of the Booster Cavity Mohamed Hassan, VyacheslavYakovlev, John Reid
Booster Parameters • The Fermilab Booster is a synchrotron that accelerates protons from 400 MeV to 8 GeV • The Booster circumference is 474.2 meters, the magnetic cycle is a biased 15 Hz sinusoid, and the RF operates at harmonic 84 of the revolution frequency
Geometry of Booster Cavity Tetrode Conn? Gap Details? Ceramic? Inner Conductor Taper Stack Pole Toshiba Tuner Conn Ferrite Tuners Some Drawing Details is Still Missing Tuner Inner Taper?
Material Properties Stack Pole Toshiba Ferrite Tuners Toshiba Differential Permeability Stack Pole Differential Permeability Not enough range Some Material Properties are Still Missing
Simplified EM Model µ=1.5 56.2 MHz µ=3 42.9 MHz µ=5 34.3 MHz
More Realistic Tuner • Added the 5 Toshiba ferrites, and the 9 Stack Pole pieces separated by the copper washers • Tuner Connection is not correct yet here
More Realistic Tuner—Permability Bounds Mu=20, 12.5 Mu=1.5, 1.5 The upper bound of permeability gives very close resonance frequency (26.99 MHz) from the measured value 26.17 MHz
Voltage Breakdown Measured • In Air ~ 3 MV/m (30 KV/cm) • In Vacuum (according to Kilpatrick) is ~ 10 MV/m (theoretical) 18 MV/m (measured) Theoretical Kilpatrick Theoretical Peter et. Al. W. Peter, R. J. Fael, A. Kadish, and L. E. Thode, “Criteria for Vacuum Breakdown in RF Cavities,” IEEE Transactions on Nuclear Science, Vol. Ns-30, No. 4, Aug 1983
Without Blending Edges µtp=8.4 µsp=12.5/20.µtp fres=37.5e6+j88.8e3 Vacc=55 KV (2 Gaps) R/Q=60 Q=212
With Blending Edges µtp=8.4 µsp=12.5/20.µtp fres=37.7e6+j88.8e3 Vacc=55 KV (2 Gaps) R/Q=59.8 Q=212 Emax-Vac=3.70 MV/m Ez-max=920 KV/m Emax-Air=2.1 MV/m Blend Radius=0.125” 1.65 MV/m 2.1 MV/m 1.69 MV/m 1.71 MV/m
With Blending Edges µtp=3 µsp=12.5/20.µtp fres=53.9e6+j86.3e3 Vacc=55 KV (2 Gaps) R/Q=130 Q=312 Emax-Vacuum=2.85 MV/m Ez-max=720 KV/m Emax-Air=1.1 MV/m Blend Radius=0.125” 0.83 MV/m 1 MV/m 0.85 MV/m 0.82 MV/m
Tuner Fields at 37 MHz Difficulties in getting accurate field representation of the triple points singularities due to limited computational resources
Tuner Fields at 37 MHz 2D Abs(Ez) 2D simulation suggests that the max field exists at the 10th , 11th ferrite piece
Specifications for Design of New Accelerating Cavities for the Fermilab Booster
Conclusion • Full 3D model with most of the fine details has been created • 3D EM simulation has been carried out at different frequencies • Identified weak points of max electric field in air and vacuum at the different frequencies • Need more data (material, geometry, and measured performance) to get the model closer to the physical structure
What is next? • More data collection • Material (Stack-Pole permeability vs. Bias Field N/A … So may be we measure it) • Geometrical features (Blended Edges, Tetrode Conn, Tuner Conn, Bias Geometry) • Measured Cavity Performance (Gap voltage vs. time, R/Q vs. freq) -- John promised to provide these data • Improve the current model to get it closer to the physical cavity • Thermal simulation to get a temperature profile along the cavity and specially in the tuner • Double the repetition rate to 15 Hz and repeat the thermal simulation • Change the pipe diameter to 3” and repeat the EM analysis • Increase the gap voltage to 86 KV and find the max fields in vacuum and air